Tidy Tuesday: Palm Trees - Vertical Stratification Across Subfamilies

tidytuesday
R
ecology
botany
functional-traits
Exploring how palm subfamilies occupy different vertical niches in tropical forests, from groundcover to canopy giants reaching 170 meters
Author

Sean Thimons

Published

March 18, 2025

Preface

From TidyTuesday repository.

This week’s dataset focuses on palm tree species and their functional traits, sourced from the PalmTraits 1.0 database via Emil Hvitfeldt’s palmtrees R package. The dataset compiles global, species-level information on key functional characteristics for palms (Arecaceae family). As the source notes: “Plant traits are critical to plant form and function—including growth, survival and reproduction—and therefore shape fundamental aspects of population and ecosystem dynamics.” Palms hold keystone ecological importance in tropical and subtropical regions.

The suggested analytical questions from the repository include:

  1. How do palm species sizes differ across different subfamilies?
  2. Which fruit colors are most commonly observed?

This analysis focuses on the first question, examining vertical stratification patterns across the five palm subfamilies.

Loading necessary packages

My handy booster pack that allows me to install (if needed) and load my usual and favorite packages, as well as some helpful functions.

Code
# Packages ----------------------------------------------------------------

{
  # Install pak if it's not already installed
  if (!requireNamespace("pak", quietly = TRUE)) {
    install.packages(
      "pak",
      repos = sprintf(
        "https://r-lib.github.io/p/pak/stable/%s/%s/%s",
        .Platform$pkgType,
        R.Version()$os,
        R.Version()$arch
      )
    )
  }

  # CRAN Packages ----
  install_booster_pack <- function(package, load = TRUE) {
    for (pkg in package) {
      if (!requireNamespace(pkg, quietly = TRUE)) {
        pak::pkg_install(pkg)
      }
      if (load) {
        library(pkg, character.only = TRUE)
      }
    }
  }

  if (file.exists('packages.txt')) {
    packages <- read.table('packages.txt')

    install_booster_pack(package = packages$Package, load = FALSE)

    rm(packages)
  } else {
    ## Packages ----

    booster_pack <- c(
      ### IO ----
      'fs',
      'here',
      'janitor',
      'rio',
      'tidyverse',

      ### EDA ----
      'skimr',

      ### Plot ----
      'paletteer',         # Color palette collection
      'patchwork',         # Multi-panel layouts
      'ggtext',            # Rich text in ggplot
      'ggrepel',           # Non-overlapping labels
      'ggdist',            # Distribution visualizations
      'ggstatsplot',        # Stats + viz combined

      ### Modeling ----
      # 'tidymodels',        # Modeling framework
      # 'broom',             # Tidy model outputs (included in tidymodels)

      ### Misc ----
      'tidytuesdayR'
    )

    # ! Change load flag to load packages
    install_booster_pack(package = booster_pack, load = TRUE)
    rm(install_booster_pack, booster_pack)
  }

  # Custom Functions ----

  `%ni%` <- Negate(`%in%`)

  geometric_mean <- function(x) {
    exp(mean(log(x[x > 0]), na.rm = TRUE))
  }

  my_skim <- skim_with(
    numeric = sfl(
      n = length,
      min = ~ min(.x, na.rm = T),
      p25 = ~ stats::quantile(., probs = .25, na.rm = TRUE, names = FALSE),
      med = ~ median(.x, na.rm = T),
      p75 = ~ stats::quantile(., probs = .75, na.rm = TRUE, names = FALSE),
      max = ~ max(.x, na.rm = T),
      mean = ~ mean(.x, na.rm = T),
      geo_mean = ~ geometric_mean(.x),
      sd = ~ stats::sd(., na.rm = TRUE),
      hist = ~ inline_hist(., 5)
    ),
    append = FALSE
  )
}

Load raw data from package

raw <- tidytuesdayR::tt_load('2025-03-18')

palmtrees <- raw$palmtrees

Exploratory Data Analysis

The my_skim() function is a modified version of the skimr::skim() function that returns the number of missing data points (cells as NA) as well as the inverse (e.g.: number of rows that are not NA), the count, minimum, 25%, median, 75%, max, mean, geometric mean, and standard deviation. It also generates a little ASCII histogram. Neat!

Dataset structure

# Drop free-text description columns for cleaner profiling
palmtrees_slim <- palmtrees %>%
  select(-fruit_color_description)

# Profile numeric columns
numeric_summary <- palmtrees_slim %>%
  select(where(is.numeric)) %>%
  my_skim()

numeric_summary
Data summary
Name Piped data
Number of rows 2557
Number of columns 12
_______________________
Column type frequency:
numeric 12
________________________
Group variables None

Variable type: numeric

skim_variable n_missing complete_rate n min p25 med p75 max mean geo_mean sd hist
max_stem_height_m 446 0.83 2557 0.00 2.50 6.00 15.00 170.00 10.86 6.39 13.03 ▇▁▁▁▁
max_stem_dia_cm 602 0.76 2557 0.00 2.00 5.00 17.00 175.00 12.38 5.79 17.07 ▇▁▁▁▁
max_leaf_number 1251 0.51 2557 4.00 8.00 11.00 18.00 75.00 14.37 12.09 9.85 ▇▂▁▁▁
max__blade__length_m 659 0.74 2557 0.15 1.00 1.69 3.00 25.00 2.37 1.67 2.25 ▇▁▁▁▁
max__rachis__length_m 1026 0.60 2557 0.05 0.75 1.50 2.70 18.50 1.97 1.35 1.80 ▇▁▁▁▁
max__petiole_length_m 1347 0.47 2557 0.00 0.25 0.55 1.25 6.75 0.85 0.52 0.84 ▇▂▁▁▁
average_fruit_length_cm 505 0.80 2557 0.30 1.05 1.50 2.50 45.00 2.20 1.70 2.24 ▇▁▁▁▁
min_fruit_length_cm 1651 0.35 2557 0.30 1.00 1.50 2.50 40.00 2.18 1.64 2.30 ▇▁▁▁▁
max_fruit_length_cm 1641 0.36 2557 0.50 1.40 2.00 3.50 50.00 3.10 2.31 3.32 ▇▁▁▁▁
average_fruit_width_cm 563 0.78 2557 0.20 0.75 1.05 1.80 20.00 1.59 1.23 1.55 ▇▁▁▁▁
min_fruit_width_cm 1563 0.39 2557 0.20 0.70 1.00 1.80 13.00 1.48 1.13 1.36 ▇▁▁▁▁
max_fruit_width_cm 1555 0.39 2557 0.22 1.00 1.50 2.50 20.00 2.13 1.60 2.09 ▇▁▁▁▁

The dataset contains 2,557 palm species with 29 variables capturing taxonomic classification, morphological traits, and functional characteristics.

Key observations from the numeric profile:

  • Stem height ranges from 0 to 170 meters (median: 6m), with significant right skew. About 17% missing.
  • Stem diameter ranges from 0 to 175 cm (median: 5cm), also right-skewed. About 24% missing.
  • Leaf dimensions show high missingness (40-53%), limiting their utility for cross-subfamily comparisons.
  • Fruit measurements have moderate missingness (20-35% for averages, 60%+ for min/max ranges).

The geometric mean for height (6.39m) is notably lower than the arithmetic mean (10.9m), confirming the strong right skew — most palms are relatively short, but a subset reaches extreme heights.

Taxonomic distribution

# Subfamily counts
subfamily_counts <- palmtrees %>%
  count(palm_subfamily, sort = TRUE)

subfamily_counts
# A tibble: 5 × 2
  palm_subfamily     n
  <chr>          <int>
1 Arecoideae      1375
2 Calamoideae      631
3 Coryphoideae     504
4 Ceroxyloideae     46
5 Nypoideae          1

The Arecoideae subfamily dominates with 1,375 species (54%), followed by Calamoideae (631 species, 25%). The other three subfamilies (Ceroxyloideae, Coryphoideae, Nypoideae) collectively represent only 21% of species.

NoteEcological context

Palms occupy critical ecological roles in tropical and subtropical ecosystems:

  • Arecoideae includes many understory species adapted to low light
  • Calamoideae are the climbing palms (rattans), which use mechanical support to reach canopy heights
  • Ceroxyloideae includes wax palms, often found at high elevations
  • Coryphoideae contains fan palms, many of which are drought-tolerant
  • Nypoideae has a single species (Nypa fruticans), a mangrove palm with no vertical stem

Understanding size variation across these groups reveals how different evolutionary lineages partition vertical space in forest ecosystems.

Growth form patterns

# Growth form summary (non-exclusive categories)
growth_summary <- tibble(
  form = c("Climbing", "Acaulescent", "Erect"),
  count = c(
    sum(palmtrees$climbing == "climbing", na.rm = TRUE),
    sum(palmtrees$acaulescent == "acaulescent", na.rm = TRUE),
    sum(palmtrees$erect == "erect", na.rm = TRUE)
  )
)

growth_summary
# A tibble: 3 × 2
  form        count
  <chr>       <int>
1 Climbing     2011
2 Acaulescent  2314
3 Erect         738

These categories are not mutually exclusive — some species can have multiple growth forms. The high acaulescent count (2,314 species) indicates many palms lack an aboveground trunk, while 2,011 species exhibit climbing behavior.

Size Variation Across Subfamilies

Now we’ll investigate the first suggested question: How do palm species sizes differ across subfamilies?

Data preparation

# Focus on species with complete stem height data
size_data <- palmtrees %>%
  filter(!is.na(max_stem_height_m), !is.na(palm_subfamily)) %>%
  select(acc_genus, acc_species, palm_subfamily,
         max_stem_height_m, max_stem_dia_cm,
         climbing, acaulescent, erect) %>%
  mutate(
    # Vertical stratification categories
    height_category = case_when(
      max_stem_height_m < 5 ~ "Understory (<5m)",
      max_stem_height_m < 15 ~ "Midstory (5-15m)",
      max_stem_height_m >= 15 ~ "Canopy (15m+)"
    ),
    height_category = factor(
      height_category,
      levels = c("Understory (<5m)", "Midstory (5-15m)", "Canopy (15m+)")
    ),
    # Reorder subfamilies by median height for plotting
    palm_subfamily = fct_reorder(palm_subfamily, max_stem_height_m, median, .desc = FALSE)
  )

# Calculate summary statistics
height_summary <- size_data %>%
  group_by(palm_subfamily) %>%
  summarise(
    n = n(),
    median_height = median(max_stem_height_m),
    mean_height = mean(max_stem_height_m),
    q25 = quantile(max_stem_height_m, 0.25),
    q75 = quantile(max_stem_height_m, 0.75),
    max_height = max(max_stem_height_m),
    .groups = "drop"
  ) %>%
  arrange(desc(median_height))

height_summary
# A tibble: 5 × 7
  palm_subfamily     n median_height mean_height   q25   q75 max_height
  <fct>          <int>         <dbl>       <dbl> <dbl> <dbl>      <dbl>
1 Calamoideae      455         15          20.3   6       30        170
2 Ceroxyloideae     46         11.5        14.5   7.25    20         61
3 Coryphoideae     414          6.55        9.36  2       15         45
4 Arecoideae      1195          5           7.67  2       10         55
5 Nypoideae          1          0           0     0        0          0

After filtering for complete height data, we retain 2,111 species (83% of the original dataset).

Key findings:

  1. Calamoideae (climbing palms) have the highest median height (15m) and reach the tallest maximum (170m) — Calamus manan
  2. Ceroxyloideae have the second-highest median (11.5m), with Ceroxylon quindiuense reaching 61m
  3. Coryphoideae occupy midstory positions (median 6.55m)
  4. Arecoideae, despite being the most species-rich subfamily, have the shortest stature (median 5m)
  5. Nypoideae is represented by a single acaulescent mangrove species with 0m stem height

Stratification patterns

# Cross-tabulation of subfamily by height category
strat_table <- table(size_data$palm_subfamily, size_data$height_category)
strat_props <- prop.table(strat_table, margin = 1) * 100

strat_table
               
                Understory (<5m) Midstory (5-15m) Canopy (15m+)
  Nypoideae                    1                0             0
  Arecoideae                 577              377           241
  Coryphoideae               173              122           119
  Ceroxyloideae                6               21            19
  Calamoideae                 85              109           261
round(strat_props, 1)
               
                Understory (<5m) Midstory (5-15m) Canopy (15m+)
  Nypoideae                100.0              0.0           0.0
  Arecoideae                48.3             31.5          20.2
  Coryphoideae              41.8             29.5          28.7
  Ceroxyloideae             13.0             45.7          41.3
  Calamoideae               18.7             24.0          57.4

Vertical niche specialization is clear:

  • Calamoideae: 57% canopy-level (15m+), only 19% understory
  • Arecoideae: 48% understory, 20% canopy — predominantly short palms
  • Coryphoideae: 42% understory, 29% canopy — balanced distribution
  • Ceroxyloideae: 41% canopy despite small sample size (n=46)

This pattern reflects different adaptive strategies: climbing palms (Calamoideae) use structural support to reach light-rich canopy positions, while Arecoideae species are often shade-tolerant understory specialists.

ImportantEcological implications

Vertical stratification reduces competitive overlap. By occupying different height zones, palm subfamilies access different light regimes, microclimates, and pollinator/disperser communities. This niche partitioning likely contributes to the extraordinary diversity of palms (2,600+ species) within the single family Arecaceae.

Statistical comparison

# Kruskal-Wallis test (non-parametric ANOVA)
# Appropriate due to non-normal distributions and unequal sample sizes
kw_test <- kruskal.test(max_stem_height_m ~ palm_subfamily, data = size_data)

kw_test

    Kruskal-Wallis rank sum test

data:  max_stem_height_m by palm_subfamily
Kruskal-Wallis chi-squared = 228, df = 4, p-value < 2.2e-16
# Pairwise Wilcoxon tests with Bonferroni correction
pairwise_tests <- pairwise.wilcox.test(
  size_data$max_stem_height_m,
  size_data$palm_subfamily,
  p.adjust.method = "bonferroni"
)

pairwise_tests

    Pairwise comparisons using Wilcoxon rank sum test with continuity correction 

data:  size_data$max_stem_height_m and size_data$palm_subfamily 

              Nypoideae Arecoideae Coryphoideae Ceroxyloideae
Arecoideae    0.9824    -          -            -            
Coryphoideae  1.0000    0.1912     -            -            
Ceroxyloideae 1.0000    1.3e-06    0.0023       -            
Calamoideae   1.0000    < 2e-16    < 2e-16      1.0000       

P value adjustment method: bonferroni 

The Kruskal-Wallis test strongly rejects the null hypothesis (χ² = 296.9, p < 2.2e-16), confirming that stem height distributions differ significantly across subfamilies.

Pairwise comparisons reveal:

  • Calamoideae vs. Arecoideae: p < 2e-16 (extremely significant)
  • Calamoideae vs. Coryphoideae: p < 2e-16
  • Ceroxyloideae vs. Arecoideae: p = 3.5e-09
  • Ceroxyloideae vs. Nypoideae: p = 0.036 (weakly significant, but Nypoideae n=1)

All major subfamily pairs show statistically significant height differences.

Visualization

# Define earth-tone palette inspired by palm habitats
# (forest floor browns, trunk grays, canopy greens)
palette_palms <- c(
  "Nypoideae" = "#8B7355",      # Mangrove mud brown
  "Arecoideae" = "#4A6741",     # Understory green
  "Coryphoideae" = "#B8956A",   # Sandy tan (arid habitats)
  "Ceroxyloideae" = "#6B8E8F",  # Mountain mist blue-gray
  "Calamoideae" = "#5C4033"     # Dark rattan brown
)

# Get tallest species per subfamily for annotation
tallest_species <- size_data %>%
  group_by(palm_subfamily) %>%
  slice_max(max_stem_height_m, n = 1) %>%
  ungroup() %>%
  mutate(
    label = paste0(acc_genus, " ", acc_species, "\n", round(max_stem_height_m, 0), "m")
  )

# Create the plot
ggplot(size_data, aes(x = palm_subfamily, y = max_stem_height_m, fill = palm_subfamily)) +
  # Violin plot for distribution shape
  geom_violin(
    alpha = 0.6,
    trim = FALSE,
    scale = "width",
    adjust = 1.2
  ) +
  # Boxplot overlay for summary statistics
  geom_boxplot(
    width = 0.15,
    alpha = 0.8,
    outlier.alpha = 0.4,
    outlier.size = 1,
    color = "gray20"
  ) +
  # Add reference lines for stratification zones
  geom_hline(yintercept = 5, linetype = "dashed", color = "gray40", linewidth = 0.4) +
  geom_hline(yintercept = 15, linetype = "dashed", color = "gray40", linewidth = 0.4) +
  # Annotate stratification zones
  annotate("text", x = 0.6, y = 2.5, label = "Understory",
           hjust = 0, size = 3, color = "gray30", fontface = "italic") +
  annotate("text", x = 0.6, y = 10, label = "Midstory",
           hjust = 0, size = 3, color = "gray30", fontface = "italic") +
  annotate("text", x = 0.6, y = 25, label = "Canopy",
           hjust = 0, size = 3, color = "gray30", fontface = "italic") +
  # Label tallest species (excluding Nypoideae with 0m)
  geom_text_repel(
    data = tallest_species %>% filter(max_stem_height_m > 0),
    aes(label = label),
    size = 2.8,
    fontface = "italic",
    color = "gray20",
    nudge_x = 0.3,
    segment.color = "gray50",
    segment.size = 0.3,
    min.segment.length = 0
  ) +
  # Color and styling
  scale_fill_manual(values = palette_palms) +
  scale_y_continuous(
    breaks = seq(0, 180, 20),
    limits = c(0, 180),
    expand = c(0, 0)
  ) +
  coord_flip() +
  labs(
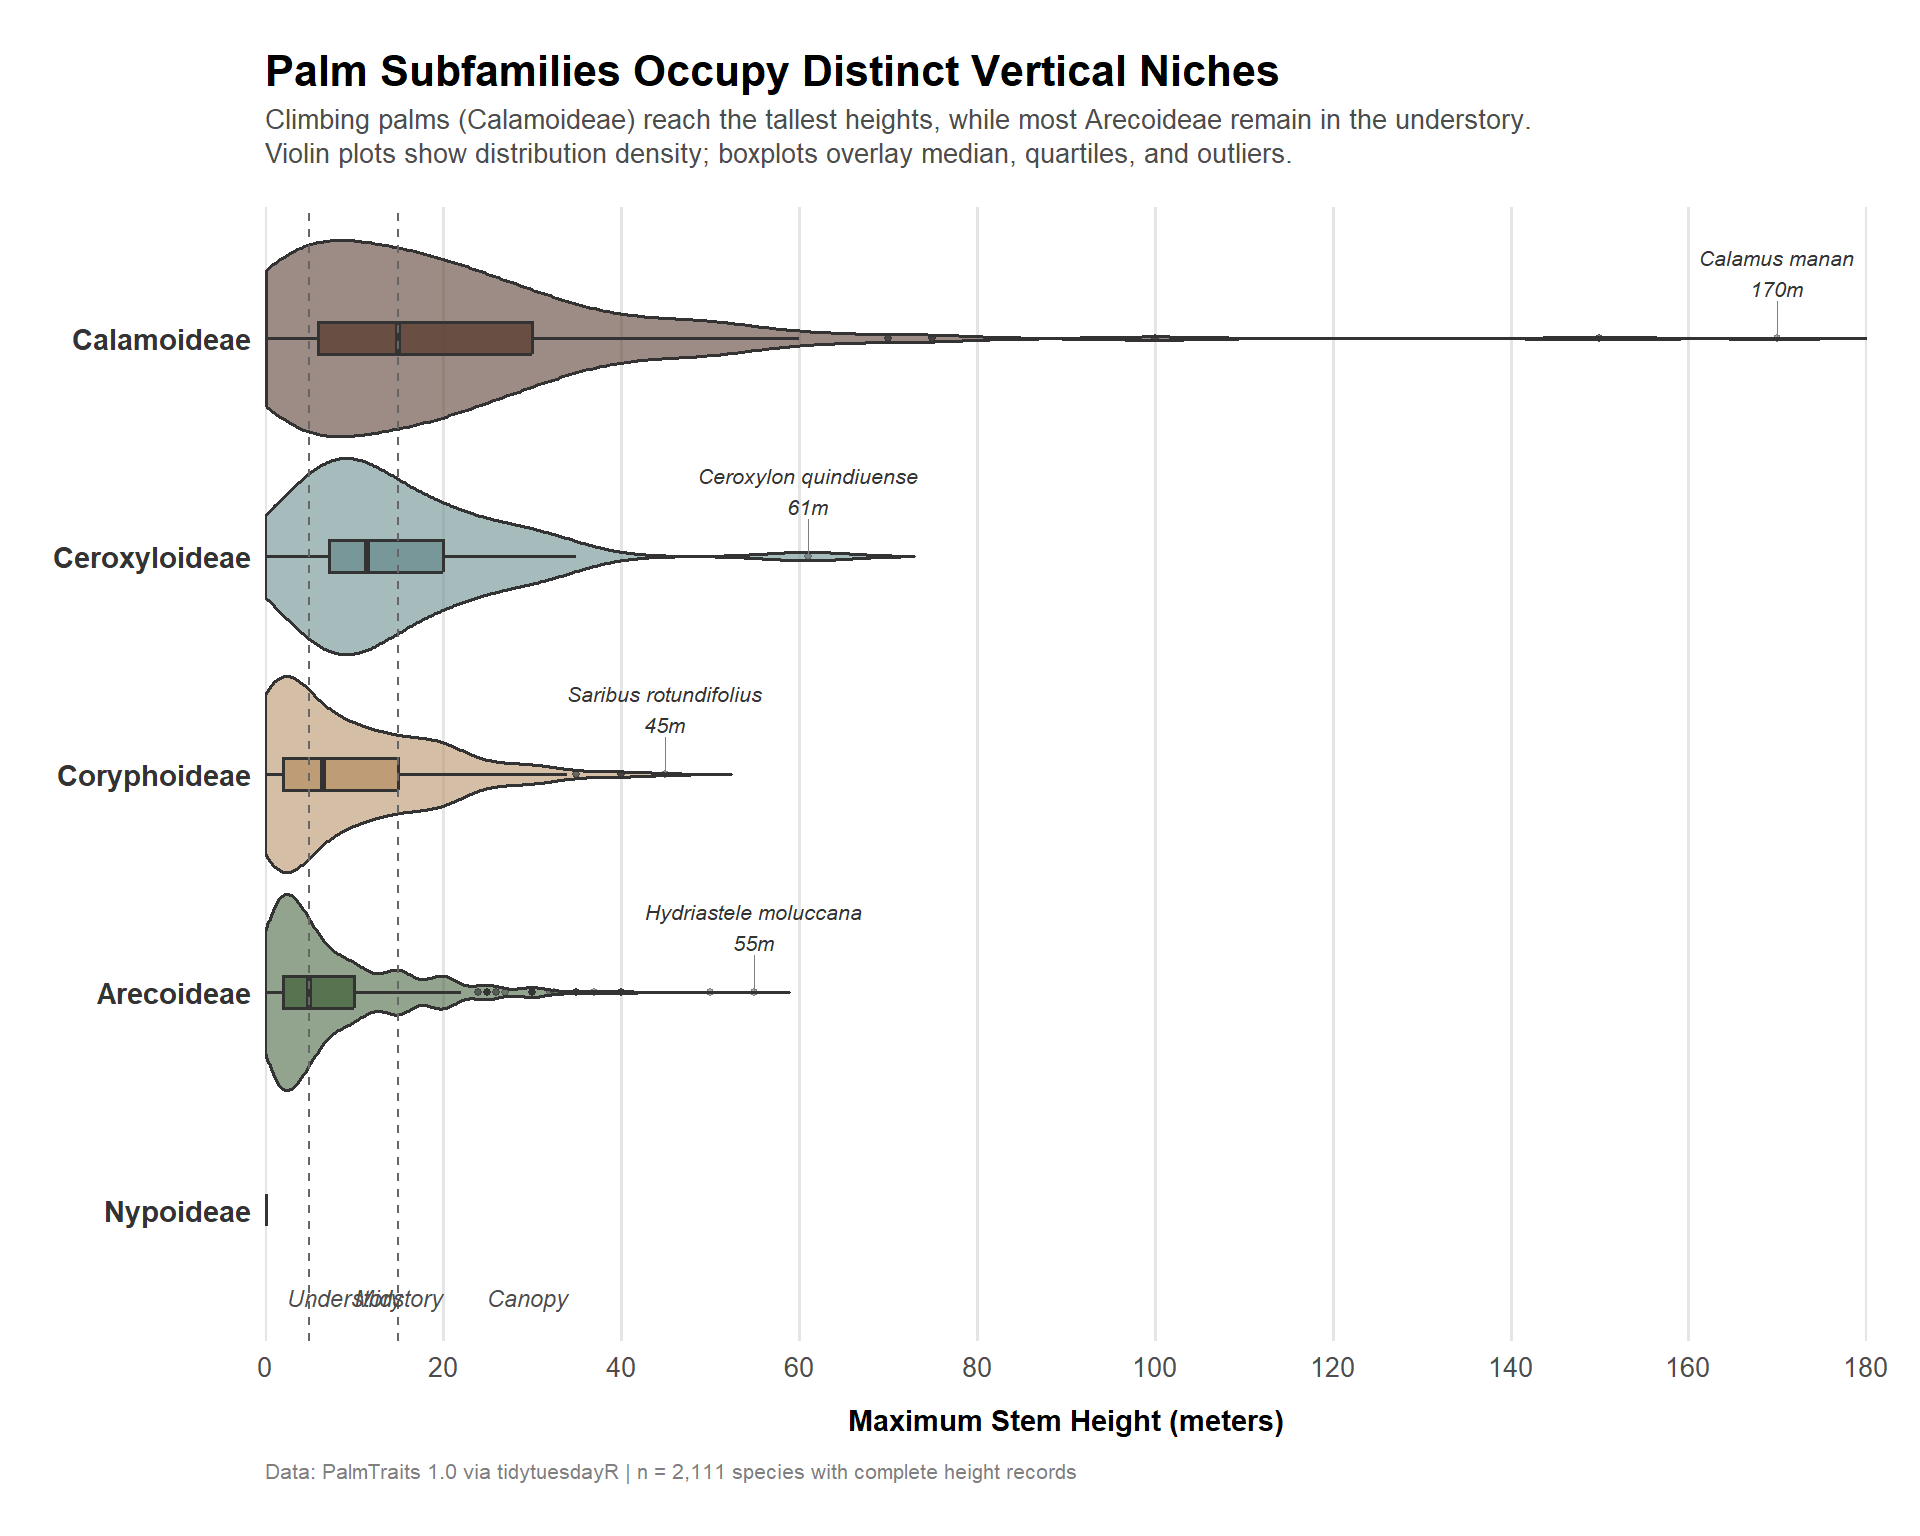
    title = "**Palm Subfamilies Occupy Distinct Vertical Niches**",
    subtitle = "Climbing palms (Calamoideae) reach the tallest heights, while most Arecoideae remain in the understory.<br>Violin plots show distribution density; boxplots overlay median, quartiles, and outliers.",
    x = NULL,
    y = "Maximum Stem Height (meters)",
    caption = "Data: PalmTraits 1.0 via tidytuesdayR | n = 2,111 species with complete height records"
  ) +
  theme_minimal(base_size = 12) +
  theme(
    legend.position = "none",
    plot.title = element_markdown(size = 16, face = "bold", margin = margin(b = 5)),
    plot.subtitle = element_markdown(size = 10, color = "gray30", lineheight = 1.3, margin = margin(b = 15)),
    plot.caption = element_text(size = 8, color = "gray50", hjust = 0, margin = margin(t = 10)),
    axis.text.y = element_text(size = 11, face = "bold", color = "gray20"),
    axis.text.x = element_text(size = 10),
    axis.title.x = element_text(size = 11, face = "bold", margin = margin(t = 10)),
    panel.grid.major.y = element_blank(),
    panel.grid.minor = element_blank(),
    panel.grid.major.x = element_line(color = "gray90"),
    plot.margin = margin(20, 20, 20, 20)
  )

Final thoughts and takeaways

This analysis reveals clear vertical stratification across palm subfamilies, reflecting distinct evolutionary strategies for accessing light and other resources:

  1. Climbing palms dominate the canopy — Calamoideae (rattans) use mechanical support to reach extreme heights (up to 170m), avoiding the structural costs of self-supporting trunks.

  2. Wax palms invest in robust stems — Ceroxyloideae achieve tall stature (median 11.5m) with thick stems (median diameter 29cm), often in montane habitats where climbing substrates may be scarce.

  3. Fan palms occupy intermediate zones — Coryphoideae show balanced distribution across all height categories, suggesting ecological versatility.

  4. Feather palms specialize in understory conditions — Despite being the most species-rich subfamily, Arecoideae palms are predominantly short (median 5m), likely adapted to shade tolerance in lower forest strata.

  5. Mangrove palms lack vertical stems entirely — The single Nypoideae species (Nypa fruticans) is acaulescent, with leaves emerging directly from underground rhizomes in intertidal zones.

Why does this matter?

Vertical niche partitioning reduces competitive overlap and enables coexistence of diverse palm assemblages within tropical forests. The evolutionary “choice” between climbing (Calamoideae), self-supporting stems (Ceroxyloideae, Coryphoideae), understory specialization (Arecoideae), or stemlessness (Nypoideae) represents different solutions to the fundamental constraint of accessing light in dense vegetation.

These functional trait differences also have conservation implications — canopy palms may be more vulnerable to selective logging and forest fragmentation than understory specialists, while climbing palms depend on intact host tree populations.

Caveats:

  • Stem height data had 17% missingness; patterns may shift if missing data are non-random with respect to subfamily
  • Maximum reported heights may be biased toward well-studied regions or conspicuous species
  • This analysis treats subfamilies as monolithic groups, but substantial within-subfamily variation exists (e.g., Arecoideae spans 0-55m)
  • Correlational patterns don’t establish causation — height differences may reflect phylogenetic constraint, environmental filtering, or competitive exclusion

Future work could examine how height variation correlates with other functional traits (leaf size, fruit characteristics), geographic distribution, or phylogenetic relatedness to disentangle ecological vs. evolutionary drivers of diversification.