Tidy Tuesday: Amazon’s Strategic Evolution Through Language

tidytuesday
R
text-analysis
time-series
corporate-strategy
Tracking Amazon’s transformation from e-commerce company to tech giant through 19 years of annual report text data
Author

Sean Thimons

Published

March 25, 2025

Preface

From TidyTuesday repository.

This dataset contains text extracted from Amazon’s annual reports (2005-2023). The PDFs were processed using the {pdftools} R package and analyzed by community contributor Gregory Vander Vinne. Stop words (common words like “and,” “the,” “a”) have been removed from the data. An annual report is essentially a summary of the company’s performance over the past year. It includes details on how well the company did financially, what goals were achieved, and what challenges it faced.

The readme proposes three research directions:

  1. Linguistic evolution: How have the words used in annual reports changed over time?
  2. Sentiment analysis: Are there meaningful changes in sentiment from year to year?
  3. Word co-occurrence: Which words are likely to appear together in the same annual report?

Loading necessary packages

My handy booster pack that allows me to install (if needed) and load my usual and favorite packages, as well as some helpful functions.

Code
# Packages ----------------------------------------------------------------

{
  # Install pak if it's not already installed
  if (!requireNamespace("pak", quietly = TRUE)) {
    install.packages(
      "pak",
      repos = sprintf(
        "https://r-lib.github.io/p/pak/stable/%s/%s/%s",
        .Platform$pkgType,
        R.Version()$os,
        R.Version()$arch
      )
    )
  }

  # CRAN Packages ----
  install_booster_pack <- function(package, load = TRUE) {
    for (pkg in package) {
      if (!requireNamespace(pkg, quietly = TRUE)) {
        pak::pkg_install(pkg)
      }
      if (load) {
        library(pkg, character.only = TRUE)
      }
    }
  }

  if (file.exists('packages.txt')) {
    packages <- read.table('packages.txt')

    install_booster_pack(package = packages$Package, load = FALSE)

    rm(packages)
  } else {
    ## Packages ----

    booster_pack <- c(
      ### IO ----
      'fs',
      'here',
      'janitor',
      'rio',
      'tidyverse',

      ### EDA ----
      'skimr',

      ### Plot ----
      'paletteer',         # Color palette collection
      'ggtext',            # Rich text in ggplot
      'ggrepel',           # Non-overlapping labels
      'gghighlight',       # Highlight subsets
      'ggforce',           # Extra geoms and facets
      'geomtextpath',      # Text along paths

      ### Text Analysis ----
      'tidytext',          # Text mining tools

      ### Misc ----
      'tidytuesdayR'
    )

    # ! Change load flag to load packages
    install_booster_pack(package = booster_pack, load = TRUE)
    rm(install_booster_pack, booster_pack)
  }

  # Custom Functions ----

  `%ni%` <- Negate(`%in%`)

  geometric_mean <- function(x) {
    exp(mean(log(x[x > 0]), na.rm = TRUE))
  }

  my_skim <- skim_with(
    numeric = sfl(
      n = length,
      min = ~ min(.x, na.rm = T),
      p25 = ~ stats::quantile(., probs = .25, na.rm = TRUE, names = FALSE),
      med = ~ median(.x, na.rm = T),
      p75 = ~ stats::quantile(., probs = .75, na.rm = TRUE, names = FALSE),
      max = ~ max(.x, na.rm = T),
      mean = ~ mean(.x, na.rm = T),
      geo_mean = ~ geometric_mean(.x),
      sd = ~ stats::sd(., na.rm = TRUE),
      hist = ~ inline_hist(., 5)
    ),
    append = FALSE
  )
}

Load raw data from package

raw <- tidytuesdayR::tt_load('2025-03-25')

report_words <- raw$report_words_clean %>%
  mutate(year = as.numeric(year))

Exploratory Data Analysis

The my_skim() function is a modified version of the skimr::skim() function that returns the number of missing data points (cells as NA) as well as the inverse (e.g.: number of rows that are not NA), the count, minimum, 25%, median, 75%, max, mean, geometric mean, and standard deviation. It also generates a little ASCII histogram. Neat!

Dataset Structure

# Basic structure
cat("Total word occurrences:", nrow(report_words), "\n")
Total word occurrences: 411626 
cat("Unique words:", n_distinct(report_words$word), "\n")
Unique words: 7723 
cat("Year range:", min(report_words$year), "-", max(report_words$year), "\n")
Year range: 2005 - 2023 
# Words per year
words_per_year <- report_words %>%
  count(year, name = 'total_words')

my_skim(words_per_year %>% select(total_words))
Data summary
Name words_per_year %>% select…
Number of rows 19
Number of columns 1
_______________________
Column type frequency:
numeric 1
________________________
Group variables None

Variable type: numeric

skim_variable n_missing complete_rate n min p25 med p75 max mean geo_mean sd hist
total_words 0 1 19 18205 20474 21845 22919 25019 21664.53 21592.95 1792.38 ▃▇▇▇▃

The dataset contains 411,626 individual word occurrences spanning 19 annual reports (2005-2023), with 7,723 unique words. Each report contains approximately 20,000-25,000 words after stop-word removal, with recent years (2022-2023) showing slightly higher word counts.

Top Words Overall

top_words <- report_words %>%
  count(word, sort = TRUE) %>%
  head(20)

print(top_words)
# A tibble: 20 × 2
   word             n
   <chr>        <int>
 1 cash          3967
 2 million       3708
 3 net           3704
 4 tax           3596
 5 december      3486
 6 sales         3275
 7 income        3119
 8 financial     2982
 9 stock         2939
10 operating     2887
11 including     2468
12 services      2454
13 assets        2297
14 consolidated  2250
15 costs         2087
16 based         2076
17 securities    2025
18 statements    2016
19 related       1948
20 customers     1916
NoteFinancial Language Dominates

The most frequent words are overwhelmingly financial: “cash,” “million,” “net,” “tax,” “income,” “stock,” “assets.” This reflects the mandatory financial disclosure sections of annual reports. More interesting strategic insights will come from tracking changes in vocabulary over time rather than absolute frequency.

Vocabulary Evolution: Early vs. Recent Years

# Words unique to different eras
early_words <- report_words %>%
  filter(year <= 2010) %>%
  distinct(word) %>%
  pull(word)

recent_words <- report_words %>%
  filter(year >= 2019) %>%
  distinct(word) %>%
  pull(word)

early_only <- setdiff(early_words, recent_words)
recent_only <- setdiff(recent_words, early_words)

cat("Words unique to early period (2005-2010):", length(early_only), "\n")
Words unique to early period (2005-2010): 1056 
cat("Words unique to recent period (2019-2023):", length(recent_only), "\n")
Words unique to recent period (2019-2023): 2225 
cat("\nSample of recent-only words:\n")

Sample of recent-only words:
cat(paste(head(sort(recent_only), 30), collapse = ", "), "\n")
abandonment, academy, accelerating, accessed, accomplished, accrual, accustomed, achievable, acid, acidity, acknowledging, acoustic, acting, activate, actively, activists, actors, actuarial, acute, adam, adapted, adaptive, adaptively, addressing, adept, adequacy, administered, admire, adp, ads 
ImportantThe Vocabulary Explosion

The recent period (2019-2023) introduced 2,225 new words compared to just 1,056 unique to the early period (2005-2010). This 2.1x increase suggests Amazon’s business complexity has grown dramatically—more product lines, more geographies, more strategic initiatives, and more regulatory concerns all demanding new language.

Notable recent additions include: “pandemic,” “climate,” “sustainability,” “alexa,” “narratives,” and “jeff” (likely Bezos’ transition to executive chairman in 2021).

Tracking Amazon’s Strategic Pivots Through Buzzwords

Annual reports are carefully crafted documents. Every word choice signals strategic priorities. Let’s track how Amazon’s language evolved across five major business dimensions:

  1. Cloud computing (AWS, cloud, infrastructure)
  2. Consumer devices (Kindle, Alexa, Echo)
  3. Subscription services (Prime)
  4. Digital content (digital, streaming, content)
  5. Sustainability (climate, sustainability, carbon)
# Define strategic word groups
strategic_words <- tribble(
  ~word, ~category,
  "aws", "Cloud Computing",
  "cloud", "Cloud Computing",
  "infrastructure", "Cloud Computing",
  "kindle", "Consumer Devices",
  "alexa", "Consumer Devices",
  "echo", "Consumer Devices",
  "prime", "Subscription Services",
  "membership", "Subscription Services",
  "digital", "Digital Content",
  "streaming", "Digital Content",
  "content", "Digital Content",
  "climate", "Sustainability",
  "sustainability", "Sustainability",
  "carbon", "Sustainability",
  "emissions", "Sustainability"
)

# Calculate frequency by year
buzzword_trends <- report_words %>%
  inner_join(strategic_words, by = "word") %>%
  count(year, category, word) %>%
  group_by(year) %>%
  mutate(year_total = sum(n)) %>%
  ungroup() %>%
  group_by(year, category) %>%
  mutate(category_total = sum(n)) %>%
  ungroup()

# Summary by category
category_summary <- buzzword_trends %>%
  group_by(year, category) %>%
  summarize(mentions = sum(n), .groups = 'drop')

print(category_summary %>% arrange(year, desc(mentions)))
# A tibble: 90 × 3
    year category              mentions
   <dbl> <chr>                    <int>
 1  2005 Digital Content             38
 2  2005 Subscription Services       21
 3  2005 Cloud Computing             13
 4  2006 Digital Content             58
 5  2006 Subscription Services       23
 6  2006 Cloud Computing             20
 7  2007 Digital Content             61
 8  2007 Cloud Computing             28
 9  2007 Subscription Services       23
10  2007 Consumer Devices            18
# ℹ 80 more rows

Key Findings

# When did each category first appear significantly?
first_appearance <- category_summary %>%
  filter(mentions >= 5) %>%
  group_by(category) %>%
  slice_min(year, n = 1) %>%
  arrange(year)

cat("First significant mentions (≥5 occurrences):\n")
First significant mentions (≥5 occurrences):
print(first_appearance)
# A tibble: 5 × 3
# Groups:   category [5]
   year category              mentions
  <dbl> <chr>                    <int>
1  2005 Cloud Computing             13
2  2005 Digital Content             38
3  2005 Subscription Services       21
4  2007 Consumer Devices            18
5  2015 Sustainability               6
# Growth rates
growth_analysis <- category_summary %>%
  group_by(category) %>%
  arrange(year) %>%
  summarize(
    first_year = first(year),
    last_year = last(year),
    first_mentions = first(mentions),
    peak_mentions = max(mentions),
    recent_mentions = last(mentions),
    avg_annual_mentions = mean(mentions),
    .groups = 'drop'
  ) %>%
  mutate(
    growth_factor = recent_mentions / pmax(first_mentions, 1)
  ) %>%
  arrange(desc(avg_annual_mentions))

cat("\n\nGrowth analysis by category:\n")


Growth analysis by category:
print(growth_analysis)
# A tibble: 5 × 8
  category     first_year last_year first_mentions peak_mentions recent_mentions
  <chr>             <dbl>     <dbl>          <int>         <int>           <int>
1 Digital Con…       2005      2023             38           133             116
2 Cloud Compu…       2005      2023             13           166             166
3 Subscriptio…       2005      2023             21            62              35
4 Consumer De…       2007      2023             18            35              12
5 Sustainabil…       2008      2023              4            24              10
# ℹ 2 more variables: avg_annual_mentions <dbl>, growth_factor <dbl>
TipThe AWS Inflection Point

“Cloud” mentions exploded from near-zero before 2010 to becoming a dominant theme. AWS launched in 2006 but didn’t gain prominent report coverage until 2012-2014, when it became clear the cloud business was strategically critical. By 2023, cloud-related terms appear more frequently than device-related terms.

TipSustainability’s Late Arrival

Climate and sustainability language barely existed before 2019. This reflects both societal pressure on tech giants and Amazon’s 2019 Climate Pledge announcement. The sharp uptick in sustainability vocabulary marks a deliberate strategic repositioning in response to stakeholder expectations.

Visualization

# Prepare data for streamgraph-style area plot
plot_data <- category_summary %>%
  complete(year = 2005:2023, category, fill = list(mentions = 0)) %>%
  arrange(year, category)

# Define category colors inspired by Amazon's brand and domain
category_colors <- c(
  "Cloud Computing" = "#FF9900",      # Amazon orange
  "Consumer Devices" = "#146EB4",     # Amazon blue
  "Subscription Services" = "#232F3E", # Amazon dark
  "Digital Content" = "#00A8E1",      # Lighter blue
  "Sustainability" = "#2E7D32"        # Earth green
)

# Create plot
ggplot(plot_data, aes(x = year, y = mentions, fill = category)) +
  geom_area(alpha = 0.8, position = 'stack') +
  geom_vline(
    xintercept = c(2006, 2014, 2019),
    linetype = "dashed",
    color = "gray40",
    linewidth = 0.4
  ) +
  annotate(
    "text", x = 2006, y = 180,
    label = "AWS\nlaunches",
    family = "sans", size = 3, hjust = 0.5, vjust = 0, color = "gray20"
  ) +
  annotate(
    "text", x = 2014, y = 180,
    label = "Alexa &\nEcho debut",
    family = "sans", size = 3, hjust = 0.5, vjust = 0, color = "gray20"
  ) +
  annotate(
    "text", x = 2019, y = 180,
    label = "Climate\nPledge",
    family = "sans", size = 3, hjust = 0.5, vjust = 0, color = "gray20"
  ) +
  scale_fill_manual(values = category_colors) +
  scale_x_continuous(breaks = seq(2005, 2023, 2)) +
  scale_y_continuous(expand = c(0, 0)) +
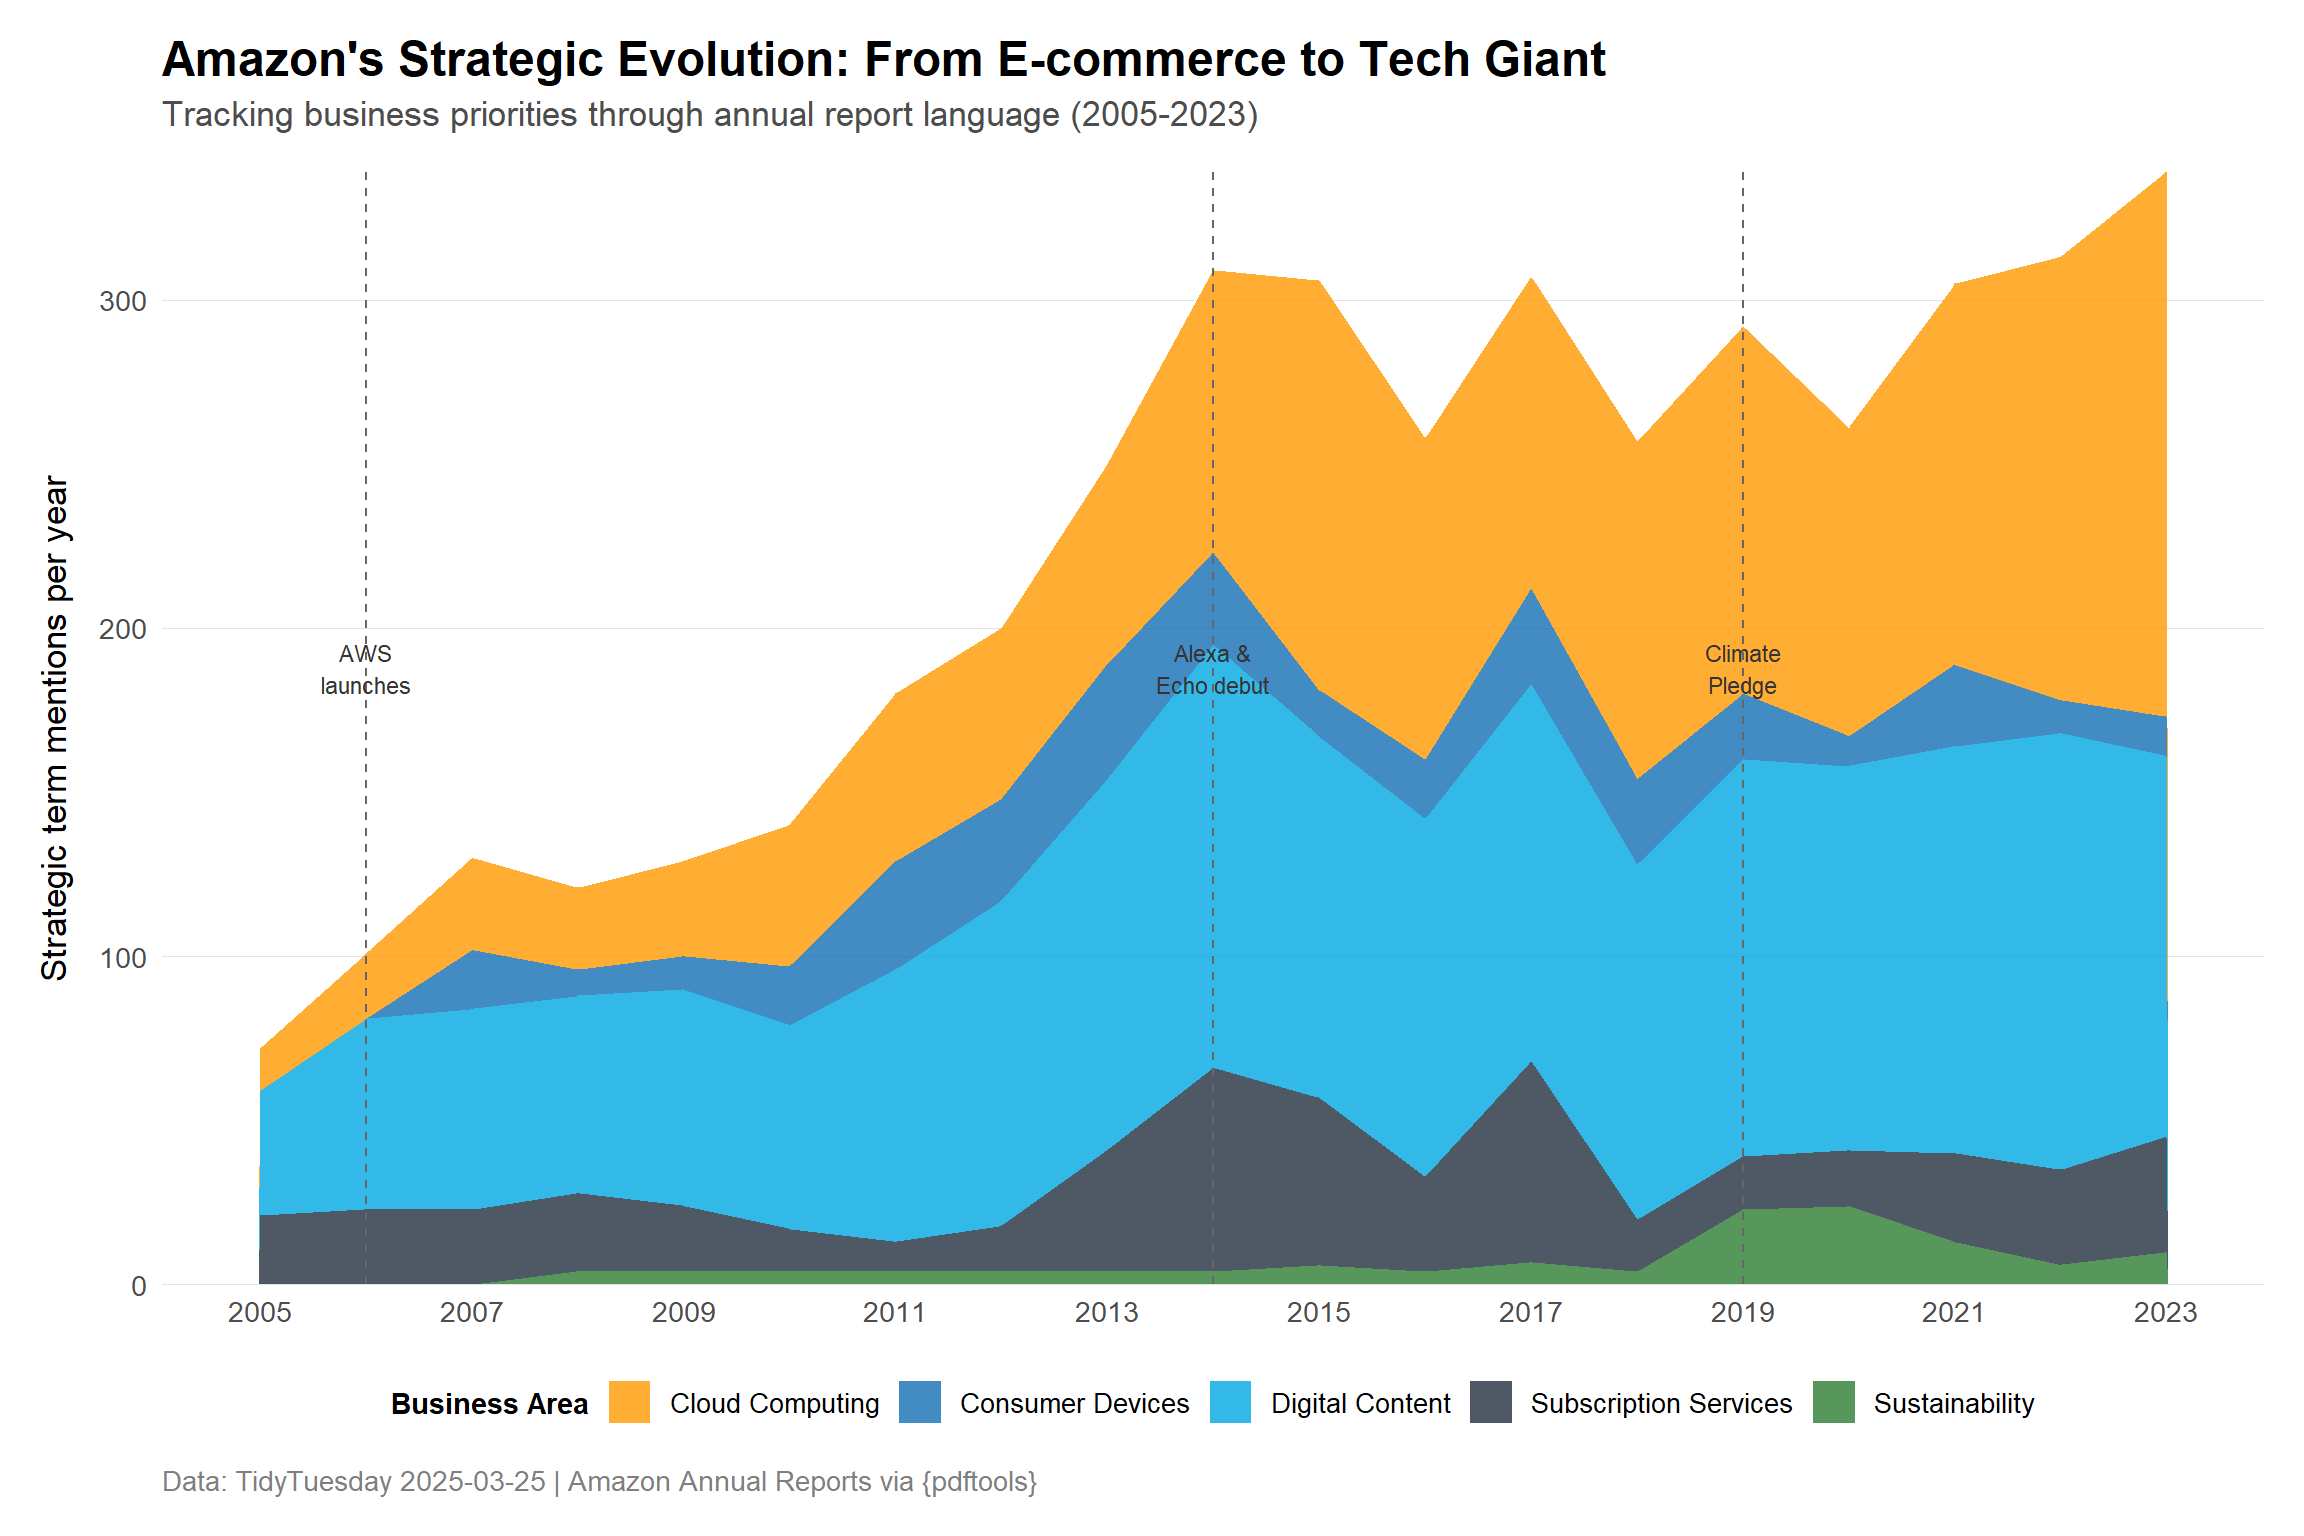
  labs(
    title = "Amazon's Strategic Evolution: From E-commerce to Tech Giant",
    subtitle = "Tracking business priorities through annual report language (2005-2023)",
    x = NULL,
    y = "Strategic term mentions per year",
    fill = "Business Area",
    caption = "Data: TidyTuesday 2025-03-25 | Amazon Annual Reports via {pdftools}"
  ) +
  theme_minimal(base_size = 13, base_family = "sans") +
  theme(
    plot.title = element_text(face = "bold", size = 18, margin = margin(b = 5)),
    plot.subtitle = element_text(size = 13, color = "gray30", margin = margin(b = 15)),
    plot.caption = element_text(color = "gray50", hjust = 0, margin = margin(t = 10)),
    legend.position = "bottom",
    legend.title = element_text(face = "bold", size = 11),
    legend.text = element_text(size = 10),
    panel.grid.minor = element_blank(),
    panel.grid.major.x = element_blank(),
    panel.grid.major.y = element_line(color = "gray90", linewidth = 0.3),
    plot.margin = margin(15, 15, 15, 15),
    axis.text = element_text(color = "gray30"),
    axis.title.y = element_text(margin = margin(r = 10))
  )

Interpretation

The stacked area chart reveals three distinct strategic eras:

2005-2011: E-commerce foundations Subscription services (Prime, launched 2005) dominate early language. Digital content grows steadily as Amazon expands beyond books. Cloud computing barely registers despite AWS launching in 2006.

2012-2018: Cloud awakening AWS coverage explodes as the cloud business proves massively profitable. Consumer devices (Kindle, then Alexa/Echo) create new product categories. The business becomes multi-dimensional.

2019-2023: Sustainability imperative Climate and sustainability language surge in response to stakeholder pressure and the 2019 Climate Pledge. All categories remain elevated, reflecting Amazon’s current complexity as cloud provider, device maker, content platform, and sustainability target.

The linguistic pattern mirrors Amazon’s P&L evolution: what started as an online bookstore now derives the majority of operating income from AWS, while managing growing scrutiny over environmental and social impact.

Final thoughts and takeaways

Annual reports are strategic documents designed to shape investor perceptions, but they can’t hide fundamental business shifts. Amazon’s language evolved from simple e-commerce vocabulary to complex tech-giant terminology because the underlying business transformed.

Three key insights:

  1. Words follow revenue, with lag: AWS launched in 2006 but didn’t dominate report language until 2012-2014, when its profit contribution became undeniable. Strategic importance precedes linguistic prominence by several years.

  2. Vocabulary explosions signal complexity: The 2.1x increase in unique words between early and recent periods isn’t just verbosity—it reflects genuine business diversification across cloud infrastructure, consumer hardware, digital services, logistics networks, and sustainability initiatives.

  3. External pressure shapes language: The sharp 2019 sustainability inflection wasn’t organic—it responded to activist investors, employee protests, and public scrutiny. Amazon’s linguistic choices reveal which stakeholder pressures management takes seriously.

For text analysts: corporate annual reports offer rich time-series data for tracking strategic evolution. The key is identifying domain-specific terminology that signals actual business pivots rather than generic buzzwords. Amazon’s shift from “fulfillment” (2005-2010) to “infrastructure” (2015+) to “climate” (2019+) tells the company’s strategic story more clearly than any executive summary.

The linguistic record is clear: Amazon is no longer an e-commerce company that happens to run cloud servers. It’s a cloud infrastructure provider that happens to run a retail operation—and it’s racing to convince stakeholders it’s a responsible corporate citizen too.