130 years of measuring, debating, and reclassifying Scotland’s highest peaks — tracking which mountains have made, lost, or regained Munro status across 11 official revisions of the Tables.
A Munro is any Scottish mountain with a height of 3,000 feet (914.4 metres) or more. The list, compiled by Sir Hugh Munro in 1891, has been revised many times as surveying technology has improved and as the committee responsible for maintaining the list has reconsidered what counts as a distinct, separate summit. This dataset tracks every mountain across all 11 official revisions of the Munro Tables from 1891 to 2021, recording whether each peak was classified as a “Munro” (a full summit) or a “Munro Top” (a subsidiary high point) in each edition.
Loading necessary packages
My handy booster pack that allows me to install (if needed) and load my usual and favorite packages, as well as some helpful functions.
raw <- tidytuesdayR::tt_load("2025-08-19")scottish_munros <- raw$scottish_munros %>% janitor::clean_names()
Exploratory Data Analysis
The my_skim() function is a modified version of the skimr::skim() function that returns the number of missing data points (cells as NA) as well as the inverse (e.g.: number of rows that are notNA), the count, minimum, 25%, median, 75%, max, mean, geometric mean, and standard deviation. It also generates a little ASCII histogram. Neat!
Scottish Munros
The year columns (1891 through 2021) contain each mountain’s classification in that edition of the Tables — either "Munro" (a full, distinct summit) or "Munro Top" (a subsidiary high point). A mountain with NA for a given year simply wasn’t listed in that edition. I’ll drop the Comments free-text column and the coordinate columns from the skim since they don’t carry distributional meaning here.
The height distribution is right-skewed — most mountains cluster between 940–1,050 m, with Ben Nevis towering at 1,344.5 m. The 1st quartile sits at 944.5 m, just 30 metres above the 914.4 m qualifying threshold. That proximity matters enormously: it means a large share of listed mountains are close enough to the borderline that improved surveying or revised definitions can bump them in or out.
# Year columnsyear_cols <-c("x1891", "x1921", "x1933", "x1953", "x1969","x1974", "x1981", "x1984", "x1990", "x1997", "x2021")# Clean year labels (janitor adds x prefix to numeric column names)year_labels <-c("1891", "1921", "1933", "1953", "1969","1974", "1981", "1984", "1990", "1997", "2021")# Verify actual values in the year columnsscottish_munros %>%select(all_of(year_cols)) %>%pivot_longer(everything(), names_to ="year", values_to ="status") %>%filter(!is.na(status)) %>%count(year, status) %>%mutate(year =factor(year, levels = year_cols, labels = year_labels)) %>%print(n =30)
# A tibble: 22 × 3
   year  status        n
   <fct> <chr>     <int>
 1 1891  Munro       283
 2 1891  Munro Top   255
 3 1921  Munro       276
 4 1921  Munro Top   267
 5 1933  Munro       276
 6 1933  Munro Top   267
 7 1953  Munro       276
 8 1953  Munro Top   267
 9 1969  Munro       276
10 1969  Munro Top   267
11 1974  Munro       279
12 1974  Munro Top   262
13 1981  Munro       276
14 1981  Munro Top   241
15 1984  Munro       277
16 1984  Munro Top   240
17 1990  Munro       277
18 1990  Munro Top   240
19 1997  Munro       284
20 1997  Munro Top   227
21 2021  Munro       282
22 2021  Munro Top   226
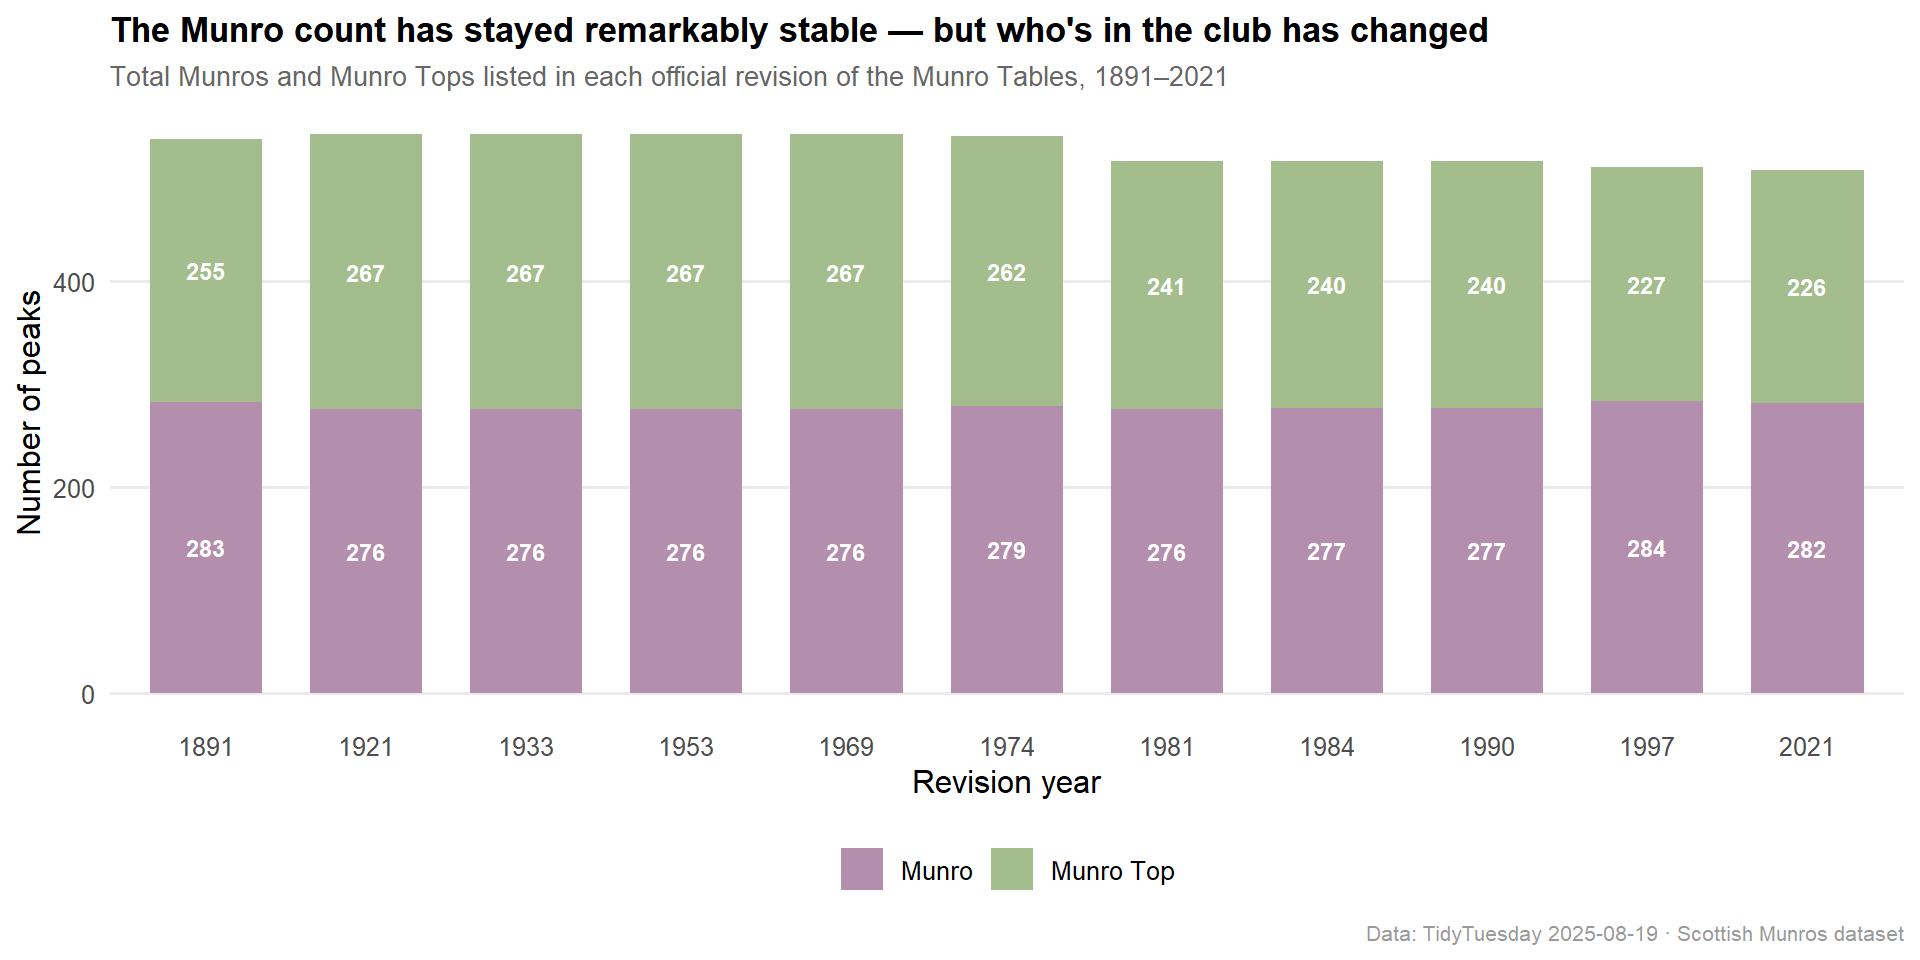
The totals are remarkably stable. After a first-pass reduction in 1921 (−7 Munros), the list held at 276 Munros for five consecutive editions. The 1997 revision pushed the count to its historical high of 284. The 2021 revision trimmed it back to 282 — one more than the original 1891 figure of 283, but arrived at through very different measurements.
The Shifting Peaks: Classification Changes Across 130 Years
The stability of the total count masks genuine churn at the individual mountain level. Across all 11 revisions, 62 mountains changed their classification at least once — bouncing between “Munro” and “Munro Top” as surveyors refined their measurements and committees reconsidered what qualifies as a distinct summit.
# Classify each mountain's journey across all editionsmunro_journey <- scottish_munros %>%select(do_bih_number, name, height_m, all_of(year_cols)) %>%rowwise() %>%mutate(status_1891 = x1891,status_2021 = x2021,ever_munro =any(c_across(all_of(year_cols)) =="Munro", na.rm =TRUE),ever_top =any(c_across(all_of(year_cols)) =="Munro Top", na.rm =TRUE),n_editions =sum(!is.na(c_across(all_of(year_cols)))),changed = ever_munro & ever_top ) %>%ungroup()# Classify the direction of change for mountains present in both 1891 and 2021munro_compare <- munro_journey %>%filter(!is.na(status_1891), !is.na(status_2021)) %>%mutate(change_type =case_when( status_1891 =="Munro"& status_2021 =="Munro Top"~"Demoted", status_1891 =="Munro Top"& status_2021 =="Munro"~"Promoted",TRUE~"Stable" ) )cat(sprintf("Total mountains with 1891 & 2021 records: %d\n", nrow(munro_compare)))
stopifnot("Timeline data is empty"=nrow(counts_timeline) >0)
Note
What separates a Munro from a Munro Top? A “Munro” is a summit considered sufficiently distinct and separate from its neighbours — it needs to feel like its own mountain, not just a shoulder of a higher peak. A “Munro Top” is a high point (also above 914.4 m) but subordinate to a full Munro. The criteria are partly objective (drop in ridge height, distance) but partly subjective — which is why the committee keeps revising the list.
How the counts have shifted across editions
# Check palette log before selectingpalette_log <-read.csv(here::here("posts", "palette-log.csv"))used_palettes <- palette_log$palettecat("Previously used palettes:", paste(used_palettes, collapse =", "), "\n")
# Using nord::aurora — not previously used. Cool Nordic tones evoke highland mist.timeline_colors <-c("Munro"= paletteer::paletteer_d("nord::aurora")[5], # muted purple"Munro Top"= paletteer::paletteer_d("nord::aurora")[4] # muted green)p_timeline <- counts_timeline %>% ggplot2::ggplot(ggplot2::aes(x = year_label, y = n, fill = status)) + ggplot2::geom_col(width =0.7, position = ggplot2::position_stack()) + ggplot2::geom_text( ggplot2::aes(label = n),position = ggplot2::position_stack(vjust =0.5),color ="white", size =3.2, fontface ="bold" ) + ggplot2::scale_fill_manual(values = timeline_colors,name =NULL,guide = ggplot2::guide_legend(reverse =TRUE) ) + ggplot2::labs(title ="The Munro count has stayed remarkably stable — but who's in the club has changed",subtitle ="Total Munros and Munro Tops listed in each official revision of the Munro Tables, 1891–2021",x ="Revision year",y ="Number of peaks",caption ="Data: TidyTuesday 2025-08-19 · Scottish Munros dataset" ) + ggplot2::theme_minimal(base_size =12) + ggplot2::theme(plot.title = ggplot2::element_text(face ="bold", size =13),plot.subtitle = ggplot2::element_text(color ="grey40", size =10),panel.grid.major.x = ggplot2::element_blank(),panel.grid.minor = ggplot2::element_blank(),legend.position ="bottom",plot.caption = ggplot2::element_text(color ="grey60", size =8) )p_timeline
The 1921 revision was the first major correction after Sir Hugh Munro’s original list. The biggest structural shift came in 1997 when the committee pushed the Munro count to 284 — its highest ever — primarily by elevating several disputed Tops. The 2021 revision nudged it back down to 282, where it stands today.
Which mountains changed, and by how much?
# Contested mountains: present in both 1891 and 2021 with a status changecontested <- munro_compare %>%filter(change_type !="Stable") %>%arrange(height_m) %>%mutate(name_short = stringr::str_trunc(name, 50, ellipsis ="…"),change_label =case_when( change_type =="Demoted"~"Munro → Top", change_type =="Promoted"~"Top → Munro" ) )cat(sprintf("Contested mountains for hero plot: %d rows\n", nrow(contested)))
Contested mountains for hero plot: 48 rows
stopifnot("Hero plot data is empty"=nrow(contested) >0)# Pre-compute the ordered factor for the y-axis (avoids ggplot2 4.x scale conflicts)contested <- contested %>%mutate(name_ordered =factor(name_short, levels = name_short[order(height_m)]))cat("\nHeight range of contested mountains:\n")
Height range of contested mountains:
print(summary(contested$height_m))
   Min. 1st Qu.  Median    Mean 3rd Qu.    Max.
  916.8   932.8   956.2   983.9  1047.1  1117.1
Important
The borderline is thin. The median height of contested mountains is around 970 m — well above the 914.4 m threshold — yet they still got reclassified. Height alone doesn’t determine Munro status; topographic prominence (how much the ridge drops before rising again) is the real deciding factor. Early surveyors couldn’t measure this precisely, so the revisions corrected for it.
Hero Visualization: Promoted and Demoted Peaks
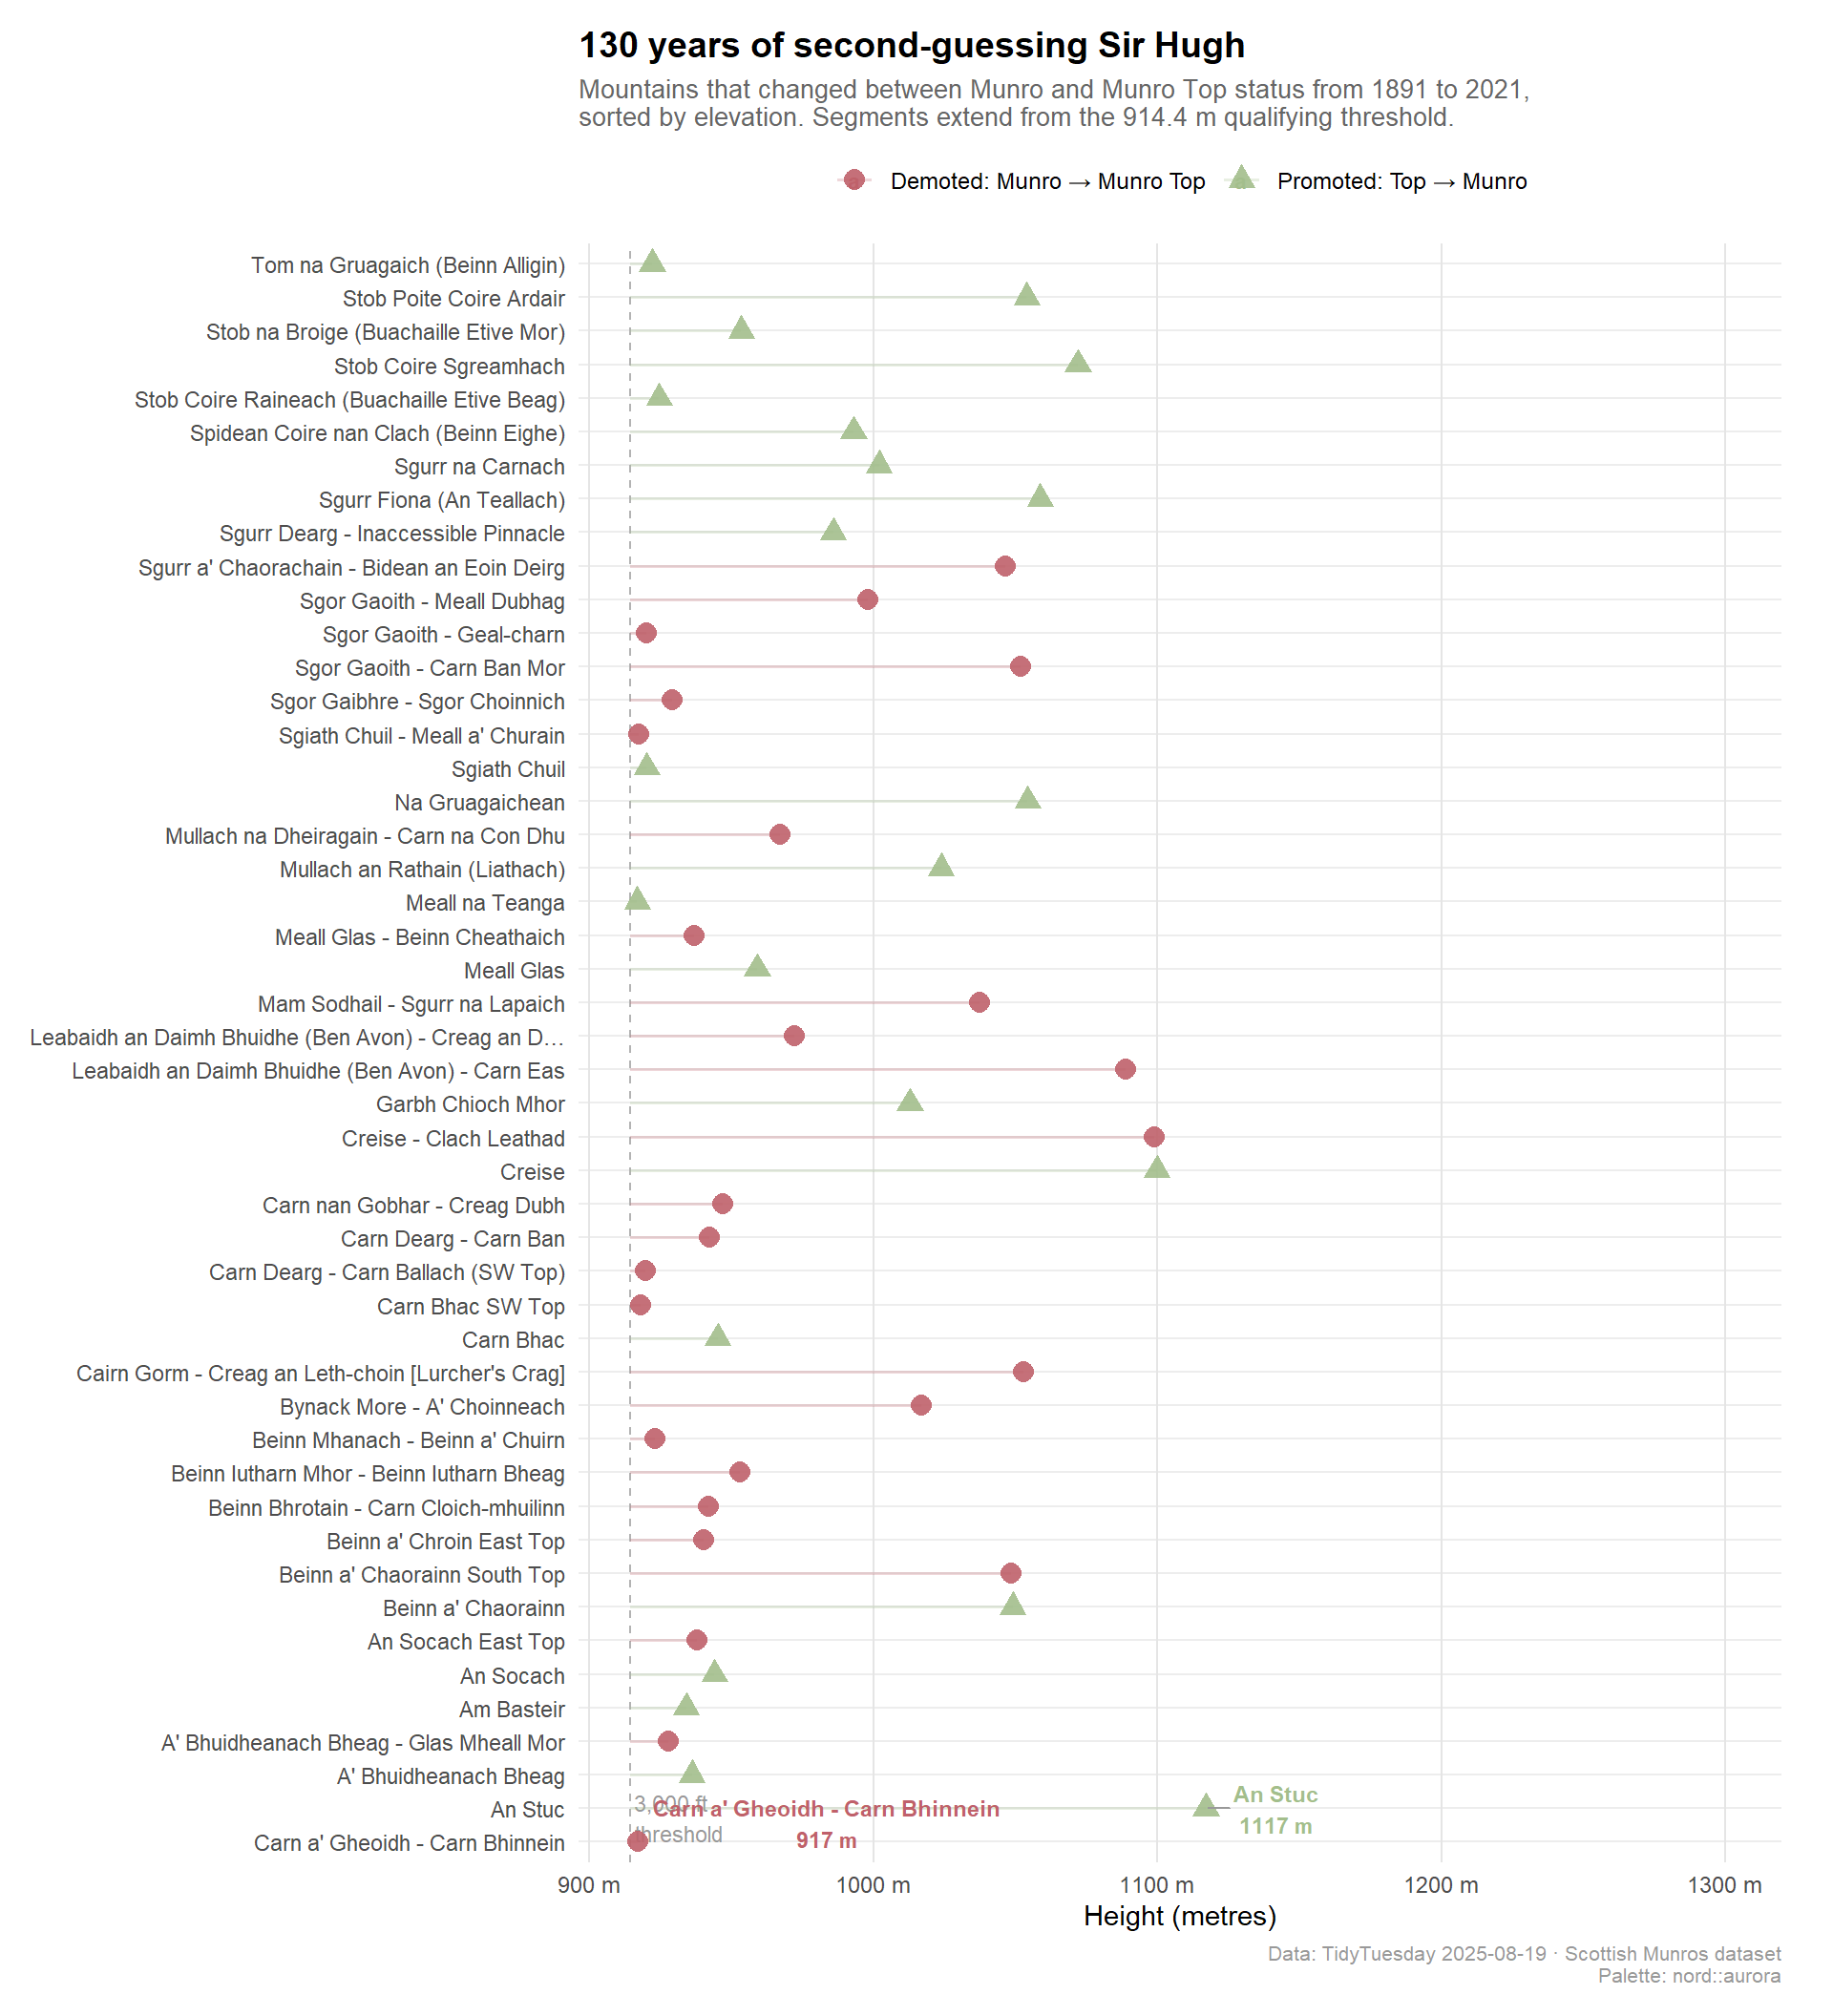
Of the 283 mountains listed as Munros in 1891, 26 had been demoted to “Munro Top” status by 2021. In the other direction, 22 mountains originally classified as Tops have since been elevated to full Munro status. The dot plot below shows all 48 mountains whose fate changed, sorted by elevation.
# Colors from nord::aurorademoted_color <-as.character(paletteer::paletteer_d("nord::aurora")[1]) # muted redpromoted_color <-as.character(paletteer::paletteer_d("nord::aurora")[4]) # muted green# Annotation helper: find the tallest promoted and shortest demotedtallest_promoted <- contested %>%filter(change_type =="Promoted") %>%slice_max(height_m, n =1)lowest_demoted <- contested %>%filter(change_type =="Demoted") %>%slice_min(height_m, n =1)# Main hero plotp_hero <- contested %>% ggplot2::ggplot(ggplot2::aes(x = height_m,y = name_ordered,color = change_type,shape = change_type )) +# Faint reference line at 914.4 m threshold ggplot2::geom_vline(xintercept =914.4,linetype ="dashed", color ="grey70", linewidth =0.5 ) + ggplot2::annotate("text", x =914.4, y =levels(contested$name_ordered)[2],label ="3,000 ft\nthreshold",hjust =-0.05, vjust =0, size =3, color ="grey60" ) +# Segment from threshold to actual height (visual "reach") ggplot2::geom_segment( ggplot2::aes(x =914.4, xend = height_m,y = name_ordered,yend = name_ordered),alpha =0.25, linewidth =0.7 ) + ggplot2::geom_point(size =3.5, alpha =0.9) +# Label the extremes ggrepel::geom_text_repel(data =bind_rows(tallest_promoted, lowest_demoted), ggplot2::aes(label =paste0(name_short, "\n", round(height_m), " m")),size =3, fontface ="bold", direction ="x",nudge_x =25, segment.color ="grey60", segment.size =0.4,box.padding =0.4 ) + ggplot2::scale_color_manual(values =c("Demoted"= demoted_color, "Promoted"= promoted_color),labels =c("Demoted"="Demoted: Munro → Munro Top", "Promoted"="Promoted: Top → Munro"),name =NULL ) + ggplot2::scale_shape_manual(values =c("Demoted"=16, "Promoted"=17),labels =c("Demoted"="Demoted: Munro → Munro Top", "Promoted"="Promoted: Top → Munro"),name =NULL ) + ggplot2::scale_x_continuous(labels =function(x) paste0(x, " m"),limits =c(900, 1300),expand = ggplot2::expansion(mult =c(0.01, 0.05)) ) + ggplot2::labs(title ="130 years of second-guessing Sir Hugh",subtitle ="Mountains that changed between Munro and Munro Top status from 1891 to 2021,\nsorted by elevation. Segments extend from the 914.4 m qualifying threshold.",x ="Height (metres)",y =NULL,caption ="Data: TidyTuesday 2025-08-19 · Scottish Munros dataset\nPalette: nord::aurora" ) + ggplot2::theme_minimal(base_size =11) + ggplot2::theme(plot.title = ggplot2::element_text(face ="bold", size =14, hjust =0),plot.subtitle = ggplot2::element_text(color ="grey40", size =10, hjust =0),axis.text.y = ggplot2::element_text(size =8.5),axis.text.x = ggplot2::element_text(size =9),panel.grid.major.y = ggplot2::element_line(color ="grey93", linewidth =0.4),panel.grid.major.x = ggplot2::element_line(color ="grey90", linewidth =0.4),panel.grid.minor = ggplot2::element_blank(),legend.position ="top",legend.text = ggplot2::element_text(size =9),plot.caption = ggplot2::element_text(color ="grey60", size =8),plot.margin = ggplot2::margin(12, 20, 12, 12) )p_hero
A few things stand out. First, the promoted mountains aren’t uniformly low-elevation: An Stuc (1,117 m), Stob Coire Raineach (1,072 m), and Stob Dubh (1,072 m) are well above the zone of ambiguity — their original “Top” status reflected a judgment about topographic independence, not height. Second, the demoted mountains include several that exceed 1,000 m: Sgor Iutharn (1,052 m), Leabaidh an Daimh Bhuidhe (1,089 m), and Carn Sgulain (1,017 m) were stripped of full Munro status not because they shrank, but because revised definitions deemed them subsidiary to a neighbouring summit.
Final thoughts and takeaways
The Munro Tables are often assumed to be a fixed, objective list — you just measure the mountains and count the ones taller than 914.4 m. The data tells a more interesting story. In 130 years, 11 committees have looked at the same hills and reached subtly different conclusions 11 times.
The total number of Munros has barely budged (283 in 1891, 282 in 2021), which creates a misleading impression of consensus. Underneath that stable headline number, 62 individual mountains have changed classification at least once. The revisions aren’t random: they track the arc of survey technology, from theodolite measurements in the late Victorian era to GPS-precise elevations after 2000. As measurements got more accurate, the list didn’t grow — it reorganised, with some disputed peaks clarified into full Munros and others clarified out.
What the data can’t capture is the culture around it. “Bagging” all 282 Munros is a serious pursuit in Scotland — roughly 6,000 people have completed the round. Every time the committee reclassifies a mountain, it invalidates or extends some completions. The 1997 revision, which pushed the count to a record 284, is remembered by long-time hill walkers with a mix of affection and exasperation.
The lesson might be that any list claiming to objectively enumerate natural features is at least partly a social construction. The mountains haven’t moved. The humans measuring and arguing about them have.