This dataset covers the premier men’s club basketball competition in Europe, featuring team information and historical performance metrics for the 2025–26 EuroLeague season. Data was curated by Natasa Anastasiadou from Wikipedia and official EuroLeague records via the EuroleagueBasketball R package.
Suggested questions: Which nations have the most EuroLeague representation? How do arena capacities vary among teams and across countries? Which organizations demonstrate the strongest historical track records?
Loading necessary packages
My handy booster pack that allows me to install (if needed) and load my usual and favorite packages, as well as some helpful functions.
raw <- tidytuesdayR::tt_load('2025-10-07')euroleague <- raw$euroleague_basketball %>% janitor::clean_names()cat(sprintf("euroleague: %d rows, %d cols\n", nrow(euroleague), ncol(euroleague)))cat("Column names after clean_names():\n")print(names(euroleague))
Exploratory Data Analysis
The my_skim() function is a modified version of the skimr::skim() function that returns the number of missing data points (cells as NA) as well as the inverse (e.g.: number of rows that are notNA), the count, minimum, 25%, median, 75%, max, mean, geometric mean, and standard deviation. It also generates a little ASCII histogram. Neat!
EuroLeague teams dataset
# Drop character-heavy columns not suited for numeric skimmingeuroleague %>%select(final_four_appearances, titles_won) %>%my_skim()
Data summary
Name
Piped data
Number of rows
20
Number of columns
2
_______________________
Column type frequency:
numeric
2
________________________
Group variables
None
Variable type: numeric
skim_variable
n_missing
complete_rate
n
min
p25
med
p75
max
mean
geo_mean
sd
hist
final_four_appearances
0
1
20
0
0
0
4.25
14
3.1
5.36
4.72
▇▂▁▁▂
titles_won
0
1
20
0
0
0
1.25
7
1.1
2.43
2.05
▇▁▁▁▁
# Country representationcat("=== Teams by country ===\n")
# A tibble: 20 × 5
   team                    country last_season final_four_appearances titles_won
   <chr>                   <chr>   <chr>                        <dbl>      <dbl>
 1 Olympiacos              Greece  3rd                             14          3
 2 Panathinaikos           Greece  4th                             13          7
 3 Real Madrid             Spain   7th                             12          6
 4 Fenerbahce              Turkey  1st                              7          2
 5 Anadolu Efes            Turkey  6th                              5          2
 6 Olimpia Milano          Italy   11th                             4          0
 7 Partizan                Serbia  12th                             3          1
 8 Monaco                  Monaco  2nd                              2          0
 9 Zalgiris                Lithua… 13th                             2          1
10 Barcelona               Spain   5th                              0          0
11 Baskonia                Spain   14th                             0          0
12 Bayern Munich           Germany 9th                              0          0
13 Crvena zvezda Meridian… Serbia  10th                             0          0
14 Dubai Basketball        United… <NA>                             0          0
15 Hapoel IBI Tel Aviv     Israel  (EuroCup)                        0          0
16 LDLC ASVEL              France  15th                             0          0
17 Maccabi Rapyd Tel Aviv  Israel  16th                             0          0
18 Paris Basketball        France  8th                              0          0
19 Valencia Basket         Spain   (EuroCup)                        0          0
20 Virtus Olidata Bologna  Italy   17th                             0          0
The data covers 20 teams in the 2025–26 EuroLeague season. A few things stand out immediately:
Spain leads in representation with 4 clubs, followed by France, Greece, Israel, Serbia, and Turkey with 2 each.
Championships are extremely concentrated. Only 6 of the 20 current teams have ever won a title, and 11 have never even reached the Final Four.
Final Four appearances range from 0 to 14. The median is 0 — most teams have never made the Final Four, revealing how elite the upper tier truly is.
Two data quality notes worth flagging: Partizan lists 3 final_four_appearances but 4 years in the years column; Olimpia Milano lists 4 appearances but only 2 years. The numeric columns appear to be the authoritative counts; the years strings may be incomplete.
Note
The EuroLeague in its current format began in 2000 (then called “EuroLeague”), but this dataset includes historical precursor competitions dating to 1988 — explaining entries like Partizan (1988) and Olimpia Milano (1992).
Parsing the Dynasties: A Year-by-Year Timeline
The most compelling story in this data isn’t the aggregate counts — it’s when teams were dominant. To answer that, I’ll parse the year-string columns (years_of_final_four_appearances and years_of_titles_won) into a long-format timeline.
# Parse Final Four appearance years to long formatff_long <- euroleague %>%filter(!is.na(years_of_final_four_appearances)) %>%select(team, country, years_of_final_four_appearances) %>%separate_rows(years_of_final_four_appearances, sep =",\\s*") %>%transmute( team, country,year =as.integer(str_trim(years_of_final_four_appearances)),event ="Final Four" )cat(sprintf("ff_long: %d rows\n", nrow(ff_long)))
ff_long: 61 rows
stopifnot("ff_long has 0 rows"=nrow(ff_long) >0)# Parse championship years to long formattitle_long <- euroleague %>%filter(!is.na(years_of_titles_won), years_of_titles_won !="None") %>%select(team, years_of_titles_won) %>%separate_rows(years_of_titles_won, sep =",\\s*") %>%transmute( team,year =as.integer(str_trim(years_of_titles_won)),event ="Champion" )cat(sprintf("title_long: %d rows\n", nrow(title_long)))
title_long: 20 rows
stopifnot("title_long has 0 rows"=nrow(title_long) >0)# Combine: Champion status overrides Final Four for same team+yearall_events <-bind_rows(ff_long, title_long) %>%group_by(team, year) %>%summarize(event =if_else(any(event =="Champion"), "Champion", first(event)),.groups ="drop" ) %>%left_join(euroleague %>%select(team, country), by ="team")cat(sprintf("\nCombined events: %d rows\n", nrow(all_events)))
# A tibble: 9 × 5
  team           country   final_four_appearances titles_won conversion_pct
  <chr>          <chr>                      <dbl>      <dbl>          <dbl>
1 Panathinaikos  Greece                        13          7           53.8
2 Real Madrid    Spain                         12          6           50
3 Zalgiris       Lithuania                      2          1           50
4 Anadolu Efes   Turkey                         5          2           40
5 Partizan       Serbia                         3          1           33.3
6 Fenerbahce     Turkey                         7          2           28.6
7 Olympiacos     Greece                        14          3           21.4
8 Monaco         Monaco                         2          0            0
9 Olimpia Milano Italy                          4          0            0
ImportantGreece: The Undisputed Capital of European Basketball
Greece’s two EuroLeague clubs — Panathinaikos and Olympiacos — have combined for 27 Final Four appearances and 10 championships from current-season teams, more than any other country by a wide margin. Spain (Real Madrid) sits second with 12 Final Fours and 6 titles. Turkey has emerged as the dominant force of the modern era with Fenerbahce (7 FF, 2 titles) and Anadolu Efes (5 FF, 2 titles).
# Define team ordering by Final Four appearances (descending), titles as tiebreakerteam_order <- euroleague %>%filter(final_four_appearances >0) %>%arrange(desc(final_four_appearances), desc(titles_won)) %>%pull(team)# Add country codes for display labelscountry_codes <-c("Greece"="GRE","Spain"="ESP","Turkey"="TUR","Italy"="ITA","Serbia"="SRB","Monaco"="MON","Lithuania"="LTU")team_labels <- euroleague %>%filter(team %in% team_order) %>%mutate(code = country_codes[country],display =paste0(team, " (", code, ")") ) %>%select(team, display) %>%# preserve team_order orderingslice(match(team_order, team))display_order <- team_labels$display# Full grid: all team × year combinations in the rangeyear_range <-min(all_events$year):max(all_events$year)timeline_data <-expand_grid(team = team_order,year = year_range) %>%left_join(all_events %>%select(team, year, event), by =c("team", "year")) %>%left_join(team_labels, by ="team") %>%mutate(event =replace_na(event, "Not in Final Four"),event =factor(event, levels =c("Not in Final Four", "Final Four", "Champion")),display =factor(display, levels =rev(display_order)) )cat(sprintf("timeline_data: %d rows, %d cols\n", nrow(timeline_data), ncol(timeline_data)))stopifnot("Plot data has 0 rows"=nrow(timeline_data) >0)# Sanity check: make sure champions are showing upcat("Champion events in timeline:\n")timeline_data %>%filter(event =="Champion") %>%count(team, sort =TRUE) %>%print()
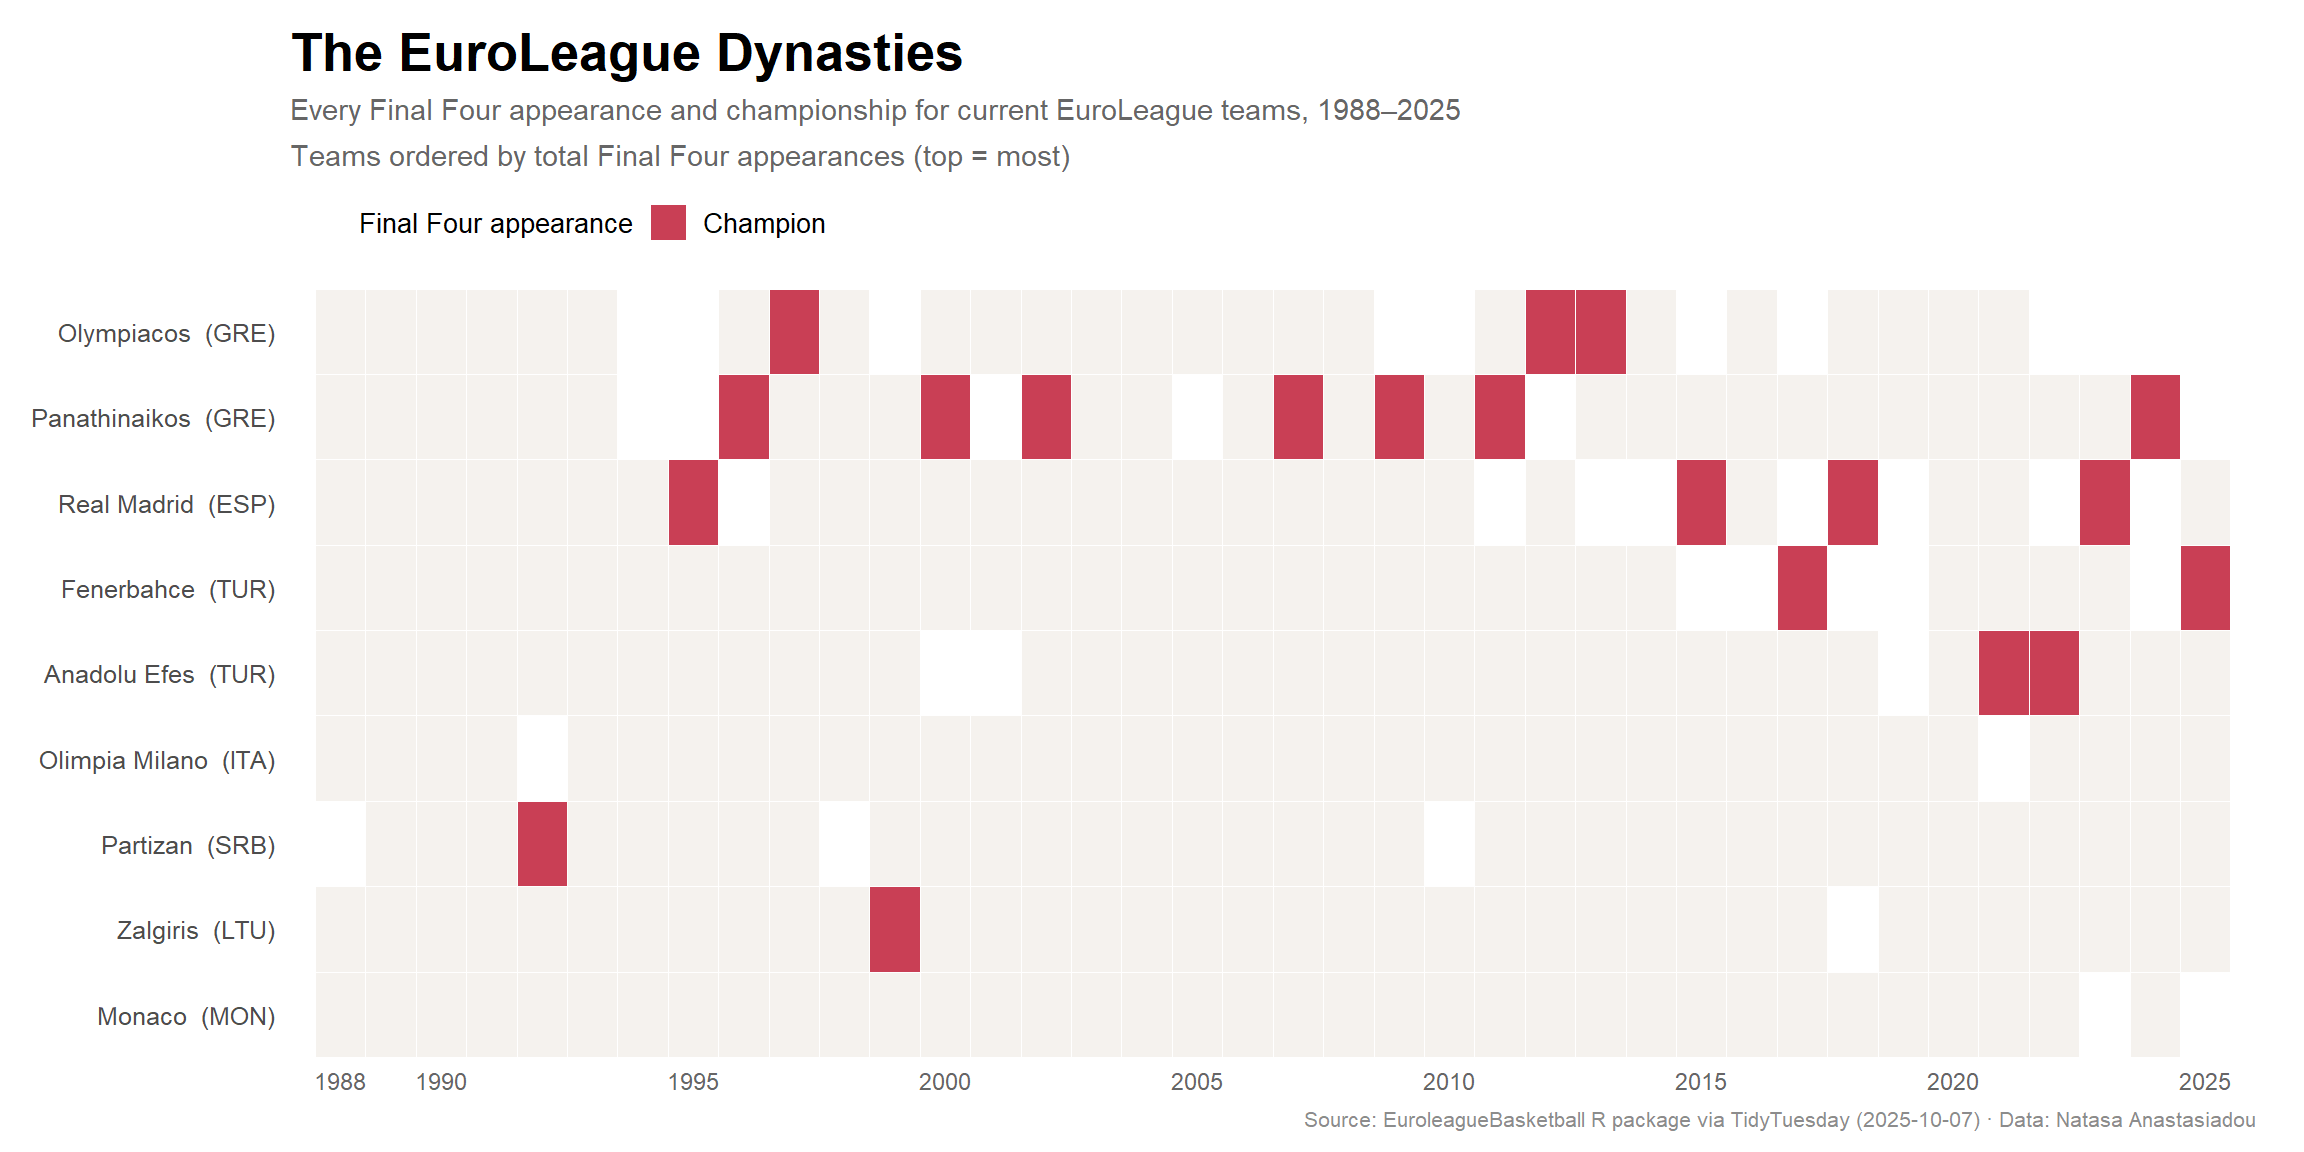
The EuroLeague Dynasties
# Color palette: MetBrewer::Klimt# Inspired by Gustav Klimt's "The Kiss" — rich golds, deep teals, and warm umbers# Perfect for a prestige historical visualizationklimt_pal <- paletteer::paletteer_d("MetBrewer::Klimt")# Preview palette# print(klimt_pal)champion_color <- klimt_pal[2] # warm amber-goldfinalist_color <- klimt_pal[7] # deep blue-slatebackground_col <-"#f5f2ee"# warm off-white for "not present"p <- ggplot2::ggplot(timeline_data, ggplot2::aes(x = year, y = display, fill = event)) + ggplot2::geom_tile(color ="white", linewidth =0.25) + ggplot2::scale_fill_manual(values =c("Not in Final Four"= background_col,"Final Four"=as.character(finalist_color),"Champion"=as.character(champion_color) ),breaks =c("Final Four", "Champion"),labels =c("Final Four appearance", "Champion") ) + ggplot2::scale_x_continuous(breaks =c(1988, seq(1990, 2025, by =5)),expand = ggplot2::expansion(add =0.5) ) + ggplot2::scale_y_discrete(expand = ggplot2::expansion(add =0.4)) + ggplot2::labs(title ="The EuroLeague Dynasties",subtitle ="Every Final Four appearance and championship for current EuroLeague teams, 1988–2025\nTeams ordered by total Final Four appearances (top = most)",x =NULL,y =NULL,fill =NULL,caption ="Source: EuroleagueBasketball R package via TidyTuesday (2025-10-07) · Data: Natasa Anastasiadou" ) + ggplot2::theme_minimal(base_size =12) + ggplot2::theme(legend.position ="top",legend.justification ="left",legend.key.size = ggplot2::unit(0.5, "cm"),legend.text = ggplot2::element_text(size =10),plot.title = ggplot2::element_text(face ="bold", size =20, hjust =0),plot.subtitle = ggplot2::element_text(size =11, color ="gray40", hjust =0, lineheight =1.3),plot.caption = ggplot2::element_text(size =8, color ="gray55"),plot.background = ggplot2::element_rect(fill ="white", color =NA),panel.grid = ggplot2::element_blank(),axis.text.y = ggplot2::element_text(size =9.5, hjust =1),axis.text.x = ggplot2::element_text(size =9, color ="gray40"),plot.margin = ggplot2::margin(12, 18, 8, 12) )p
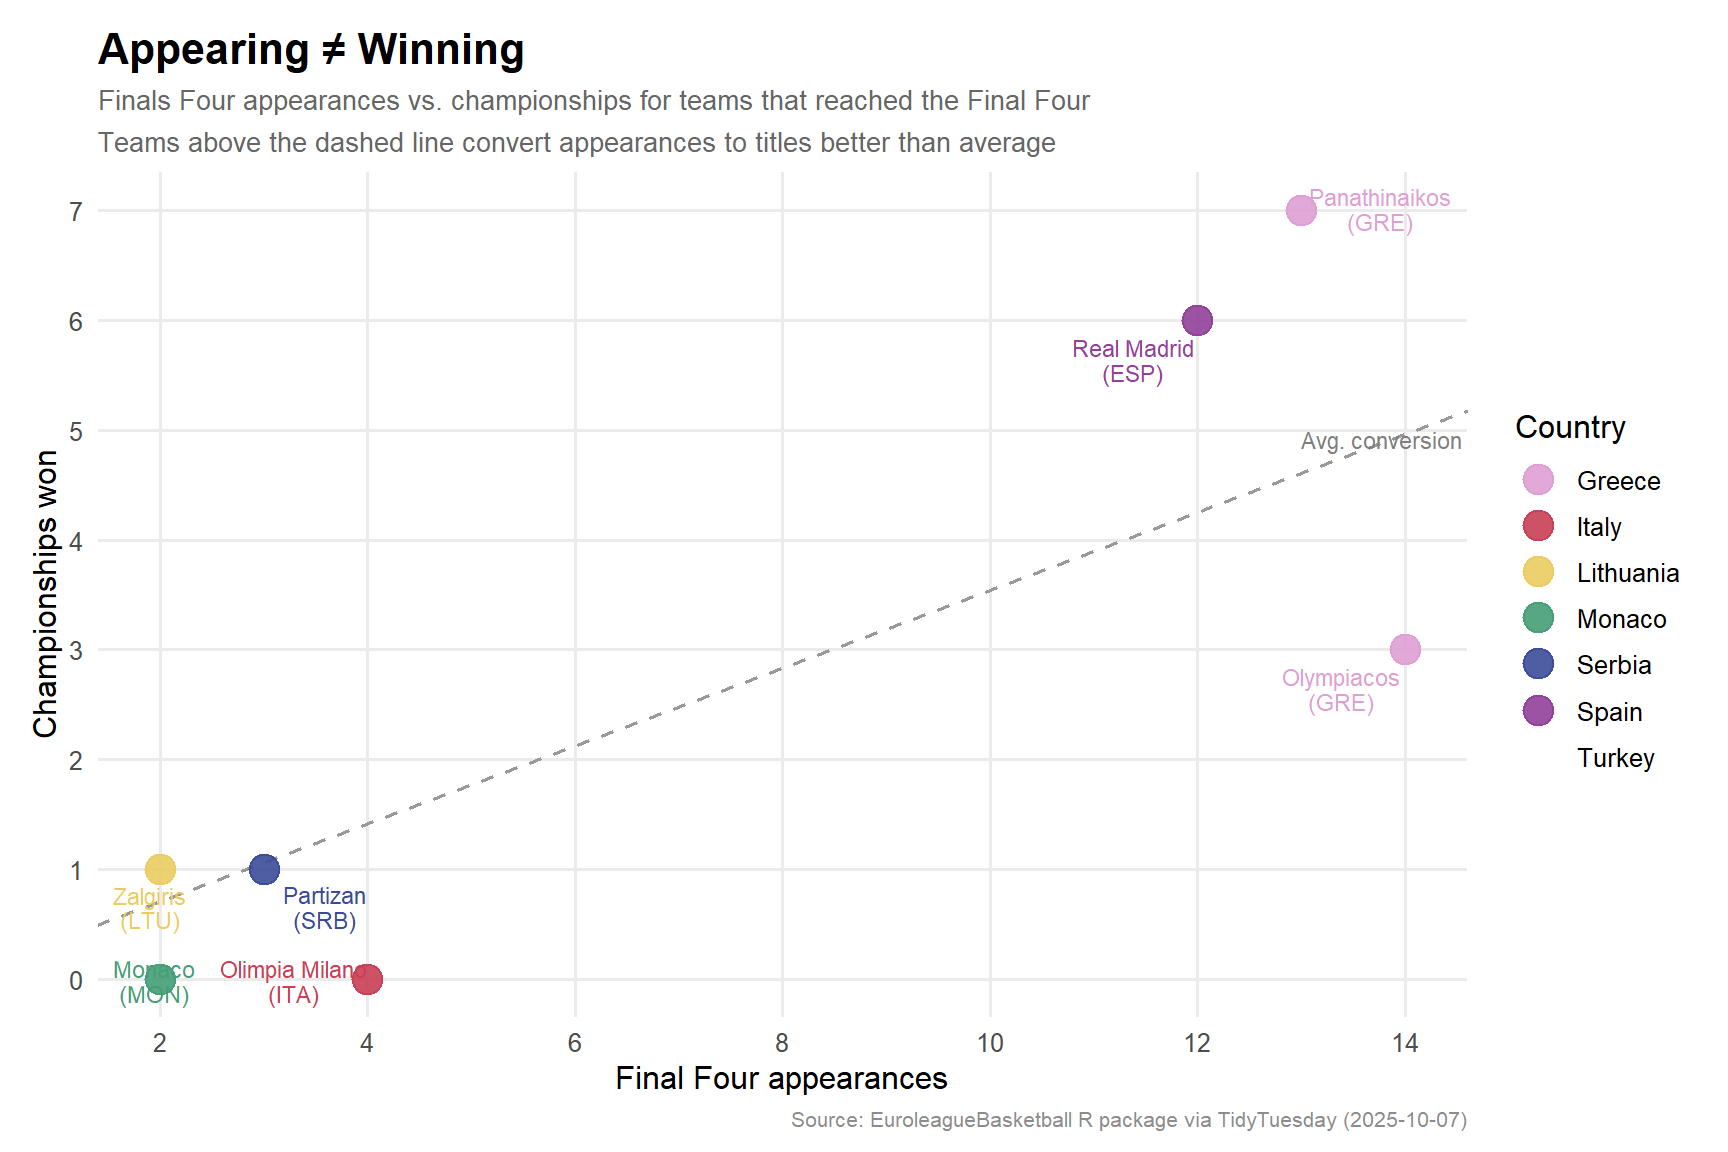
# Supplementary: Final Four appearances vs. Titles Won (conversion efficiency)conversion_data <- euroleague %>%filter(final_four_appearances >0) %>%mutate(conversion_pct = titles_won / final_four_appearances,country_code = country_codes[country] )stopifnot("conversion_data has 0 rows"=nrow(conversion_data) >0)# Sanity checkif (length(unique(conversion_data$conversion_pct)) ==1) {warning("All conversion_pct values identical — check grouping logic")}# Overall average conversion rate (among teams with ≥1 FF)avg_conversion <-sum(euroleague$titles_won) /sum(euroleague$final_four_appearances[euroleague$final_four_appearances >0])p2 <- ggplot2::ggplot( conversion_data, ggplot2::aes(x = final_four_appearances, y = titles_won, color = country)) +# Reference line: average conversion slope ggplot2::geom_abline(slope = avg_conversion,intercept =0,linetype ="dashed",color ="gray60",linewidth =0.6 ) + ggplot2::geom_point(size =5, alpha =0.9) + ggrepel::geom_text_repel( ggplot2::aes(label =paste0(team, "\n(", country_code, ")")),size =3,lineheight =0.9,box.padding =0.4,point.padding =0.3,show.legend =FALSE ) + ggplot2::annotate("text",x =13, y = avg_conversion *13+0.3,label ="Avg. conversion rate",size =3, color ="gray50", hjust =0 ) + paletteer::scale_color_paletteer_d("MetBrewer::Klimt") + ggplot2::scale_x_continuous(breaks =seq(0, 14, by =2)) + ggplot2::scale_y_continuous(breaks =0:8) + ggplot2::labs(title ="Appearing ≠ Winning",subtitle ="Finals Four appearances vs. championships for teams that reached the Final Four\nTeams above the dashed line convert appearances to titles better than average",x ="Final Four appearances",y ="Championships won",color ="Country",caption ="Source: EuroleagueBasketball R package via TidyTuesday (2025-10-07)" ) + ggplot2::theme_minimal(base_size =12) + ggplot2::theme(legend.position ="right",plot.title = ggplot2::element_text(face ="bold", size =16, hjust =0),plot.subtitle = ggplot2::element_text(size =10, color ="gray40", hjust =0, lineheight =1.3),plot.caption = ggplot2::element_text(size =8, color ="gray55"),plot.background = ggplot2::element_rect(fill ="white", color =NA),panel.grid.minor = ggplot2::element_blank(),plot.margin = ggplot2::margin(12, 12, 8, 12) )p2
Final thoughts and takeaways
The EuroLeague dynasty story resolves into three distinct eras and a clear hierarchy of greatness.
Greek supremacy defined the competition’s first two decades. Panathinaikos and Olympiacos together won 10 of the 22 championships between 1996 and 2025, with Athens clubs reaching the Final Four in nearly every season. Panathinaikos remains the most efficient champion in EuroLeague history — a 54% title-conversion rate (7 titles from 13 Final Four appearances) that no other club comes close to matching.
Real Madrid’s sustained excellence is underappreciated. Twelve Final Four appearances and 6 championships over 30 years is a record built through consistent squad investment, not lucky runs. Where Athens clubs tended to cluster their successes in bursts, Madrid has been perpetually dangerous.
Turkey’s rise is the defining narrative of the modern era. Fenerbahce’s 7 Final Four appearances in just 11 years (2015–2025) and Anadolu Efes winning back-to-back titles in 2021–22 mark a genuine shift in continental power — the Ottoman Empire’s symbolic successors claiming their own dynasty.
The gulf between elite and the rest is stark. Eleven of the 20 current EuroLeague teams have zero Final Four appearances. For clubs like Dubai Basketball, Paris Basketball, and Valencia Basket, the competition’s prestige is aspiration, not inheritance.
One genuine limitation: the dataset reflects only current EuroLeague member clubs. Historic giants like CSKA Moscow (multiple-time champions) and Maccabi Tel Aviv (5 titles) are absent because they’re not in the 2025–26 competition — a reminder that the standings here measure presence, not the full sweep of European basketball history.