Tidy Tuesday: Languages of Africa

tidytuesday
R
linguistics
africa
Mapping the linguistic diversity of Africa — which language families dominate, which countries are most multilingual, and how many speakers do they represent?
Author

Sean Thimons

Published

January 13, 2026

Preface

From TidyTuesday repository.

This dataset explores popular languages spoken across the African continent, sourced from the Wikipedia page “Languages of Africa.” The collection captures linguistic diversity with estimates of between 1,250 and 3,000+ languages natively spoken in Africa, depending on how language versus dialect distinctions are made.

  • Which African country has the largest number of spoken languages?
  • Which language family demonstrates the highest speaker density?
  • Do any languages span multiple countries?

Loading necessary packages

My handy booster pack that allows me to install (if needed) and load my usual and favorite packages, as well as some helpful functions.

Code
# Packages ----------------------------------------------------------------

{
  if (!requireNamespace("pak", quietly = TRUE)) {
    install.packages(
      "pak",
      repos = sprintf(
        "https://r-lib.github.io/p/pak/stable/%s/%s/%s",
        .Platform$pkgType,
        R.Version()$os,
        R.Version()$arch
      )
    )
  }

  install_booster_pack <- function(package, load = TRUE) {
    for (pkg in package) {
      if (!requireNamespace(pkg, quietly = TRUE)) {
        pak::pkg_install(pkg)
      }
      if (load) {
        library(pkg, character.only = TRUE)
      }
    }
  }

  if (file.exists('packages.txt')) {
    packages <- read.table('packages.txt')
    install_booster_pack(package = packages$Package, load = FALSE)
    rm(packages)
  } else {
    booster_pack <- c(
      ### IO ----
      'fs',
      'here',
      'janitor',
      'rio',
      'tidyverse',

      ### EDA ----
      'skimr',

      ### Plot ----
      'ggrepel',
      'ggtext',
      'scales',

      ### Misc ----
      'tidytuesdayR'
    )

    install_booster_pack(package = booster_pack, load = TRUE)
    rm(install_booster_pack, booster_pack)
  }

  # Custom Functions ----

  `%ni%` <- Negate(`%in%`)

  geometric_mean <- function(x) {
    exp(mean(log(x[x > 0]), na.rm = TRUE))
  }

  my_skim <- skim_with(
    numeric = sfl(
      n = length,
      min = ~ min(.x, na.rm = T),
      p25 = ~ stats::quantile(., probs = .25, na.rm = TRUE, names = FALSE),
      med = ~ median(.x, na.rm = T),
      p75 = ~ stats::quantile(., probs = .75, na.rm = TRUE, names = FALSE),
      max = ~ max(.x, na.rm = T),
      mean = ~ mean(.x, na.rm = T),
      geo_mean = ~ geometric_mean(.x),
      sd = ~ stats::sd(., na.rm = TRUE),
      hist = ~ inline_hist(., 5)
    ),
    append = FALSE
  )
}

Load raw data from package

raw <- tidytuesdayR::tt_load('2026-01-13')

africa <- raw$africa

Exploratory Data Analysis

The my_skim() function is a modified version of the skimr::skim() function that returns the number of missing data points (cells as NA) as well as the inverse (e.g.: number of rows that are not NA), the count, minimum, 25%, median, 75%, max, mean, geometric mean, and standard deviation. It also generates a little ASCII histogram. Neat!

African Languages

africa %>%
  my_skim(.)
Data summary
Name Piped data
Number of rows 796
Number of columns 4
_______________________
Column type frequency:
character 3
numeric 1
________________________
Group variables None

Variable type: character

skim_variable n_missing complete_rate min max empty n_unique whitespace
language 0 1 2 35 0 502 0
family 0 1 3 13 0 17 0
country 0 1 4 24 0 51 0

Variable type: numeric

skim_variable n_missing complete_rate n min p25 med p75 max mean geo_mean sd hist
native_speakers 0 1 796 12 19000 162500 1500000 1.5e+08 5007571 171676.8 19516644 ▇▁▁▁▁
africa %>%
  count(family, sort = TRUE)
# A tibble: 17 × 2
   family            n
   <chr>         <int>
 1 Niger–Congo     583
 2 Nilo-Saharan    108
 3 Afroasiatic      46
 4 Ubangian         11
 5 Indo-European    10
 6 Khoe–Kwadi        9
 7 Kxʼa              9
 8 Afro-Asiatic      5
 9 Arabic-based      3
10 English           2
11 French            2
12 Kongo-based       2
13 Tuu               2
14 Austronesian      1
15 Language          1
16 Mande             1
17 Portuguese        1
africa %>%
  count(country, sort = TRUE) %>%
  head(15)
# A tibble: 15 × 2
   country          n
   <chr>        <int>
 1 Cameroon        96
 2 Congo           85
 3 Nigeria         73
 4 Sudan           40
 5 Burkina Faso    37
 6 Ghana           34
 7 South Africa    25
 8 Chad            24
 9 Namibia         24
10 Mali            23
11 South Sudan     23
12 Angola          22
13 Zambia          22
14 Zimbabwe        20
15 Ethiopia        18

Linguistic Diversity Analysis

Most Multilingual Countries

Which countries host the largest number of distinct languages in this dataset?

country_diversity <- africa %>%
  group_by(country) %>%
  summarize(
    n_languages = n_distinct(language),
    n_families = n_distinct(family),
    total_speakers = sum(native_speakers, na.rm = TRUE),
    .groups = "drop"
  ) %>%
  arrange(desc(n_languages))

country_diversity %>% head(15)
# A tibble: 15 × 4
   country                  n_languages n_families total_speakers
   <chr>                          <int>      <int>          <dbl>
 1 Cameroon                          95          3       57992612
 2 Congo                             79          4      109436900
 3 Nigeria                           73          3      228056100
 4 Sudan                             40          3      153136200
 5 Burkina Faso                      36          2       94832060
 6 Ghana                             34          3      131188900
 7 Chad                              24          4      164297630
 8 Namibia                           24          5       17664220
 9 South Sudan                       23          4        9728000
10 Angola                            22          4       36591800
11 Mali                              22          4       81193000
12 South Africa                      21          4       85389500
13 Zambia                            21          2       19318400
14 Ivory Coast                       18          1       23153050
15 Central African Republic          17          3        3171120

Language Families by Speaker Count

Which language families have the most total native speakers?

family_stats <- africa %>%
  group_by(family) %>%
  summarize(
    n_languages = n_distinct(language),
    total_speakers = sum(native_speakers, na.rm = TRUE),
    median_speakers = median(native_speakers, na.rm = TRUE),
    .groups = "drop"
  ) %>%
  arrange(desc(total_speakers))

family_stats
# A tibble: 17 × 4
   family        n_languages total_speakers median_speakers
   <chr>               <int>          <dbl>           <dbl>
 1 Afroasiatic            17     2369939800        21937940
 2 Niger–Congo           383     1353163982          150000
 3 Nilo-Saharan           70      111091000          110000
 4 Indo-European           4      101665300        12100000
 5 Kongo-based             1       26000000        13000000
 6 Austronesian            1       18000000        18000000
 7 Ubangian                6        1590000           27000
 8 French                  2        1173000          586500
 9 Portuguese              1         871000          871000
10 English                 2         866000          433000
11 Afro-Asiatic            4         714300           18000
12 Arabic-based            2         350000           50000
13 Khoe–Kwadi              4         259500            8000
14 Mande                   1         230000          230000
15 Kxʼa                    4         107500           16500
16 Tuu                     1           5000            2500
17 Language                1            400             400

Cross-Border Languages

Do any languages span multiple countries?

cross_border <- africa %>%
  group_by(language) %>%
  summarize(
    n_countries = n_distinct(country),
    countries = paste(unique(country), collapse = ", "),
    total_speakers = sum(native_speakers, na.rm = TRUE),
    .groups = "drop"
  ) %>%
  filter(n_countries > 1) %>%
  arrange(desc(n_countries))

cross_border
# A tibble: 155 × 4
   language   n_countries countries                               total_speakers
   <chr>            <int> <chr>                                            <dbl>
 1 Arabic              12 Algeria, Chad, Comoros, Djibouti, Egyp…     1800000000
 2 Fulani              10 Benin, Burkina Faso, Cameroon, Gambia,…      440000000
 3 Mooré                8 Burkina Faso, Benin, Ivory Coast, Ghan…      108000000
 4 Soninke              8 Mauritania, Mali, Senegal, Gambia, Bur…       29900000
 5 Gourmanché           6 Benin, Burkina Faso, Ghana, Niger, Nig…        9000000
 6 Lozi                 6 Angola, Botswana, Namibia, South Afric…        4350000
 7 Bariba               5 Benin, Burkina Faso, Niger, Nigeria, T…        6600000
 8 Khwe                 5 Namibia, Angola, Botswana, South Afric…          40000
 9 Mampruli             5 Burkina Faso, Ghana, Ivory Coast, Mali…        1150000
10 Portuguese           5 Angola, Cape Verde, Guinea, Equatorial…       85000000
# ℹ 145 more rows

Visualizing Linguistic Diversity

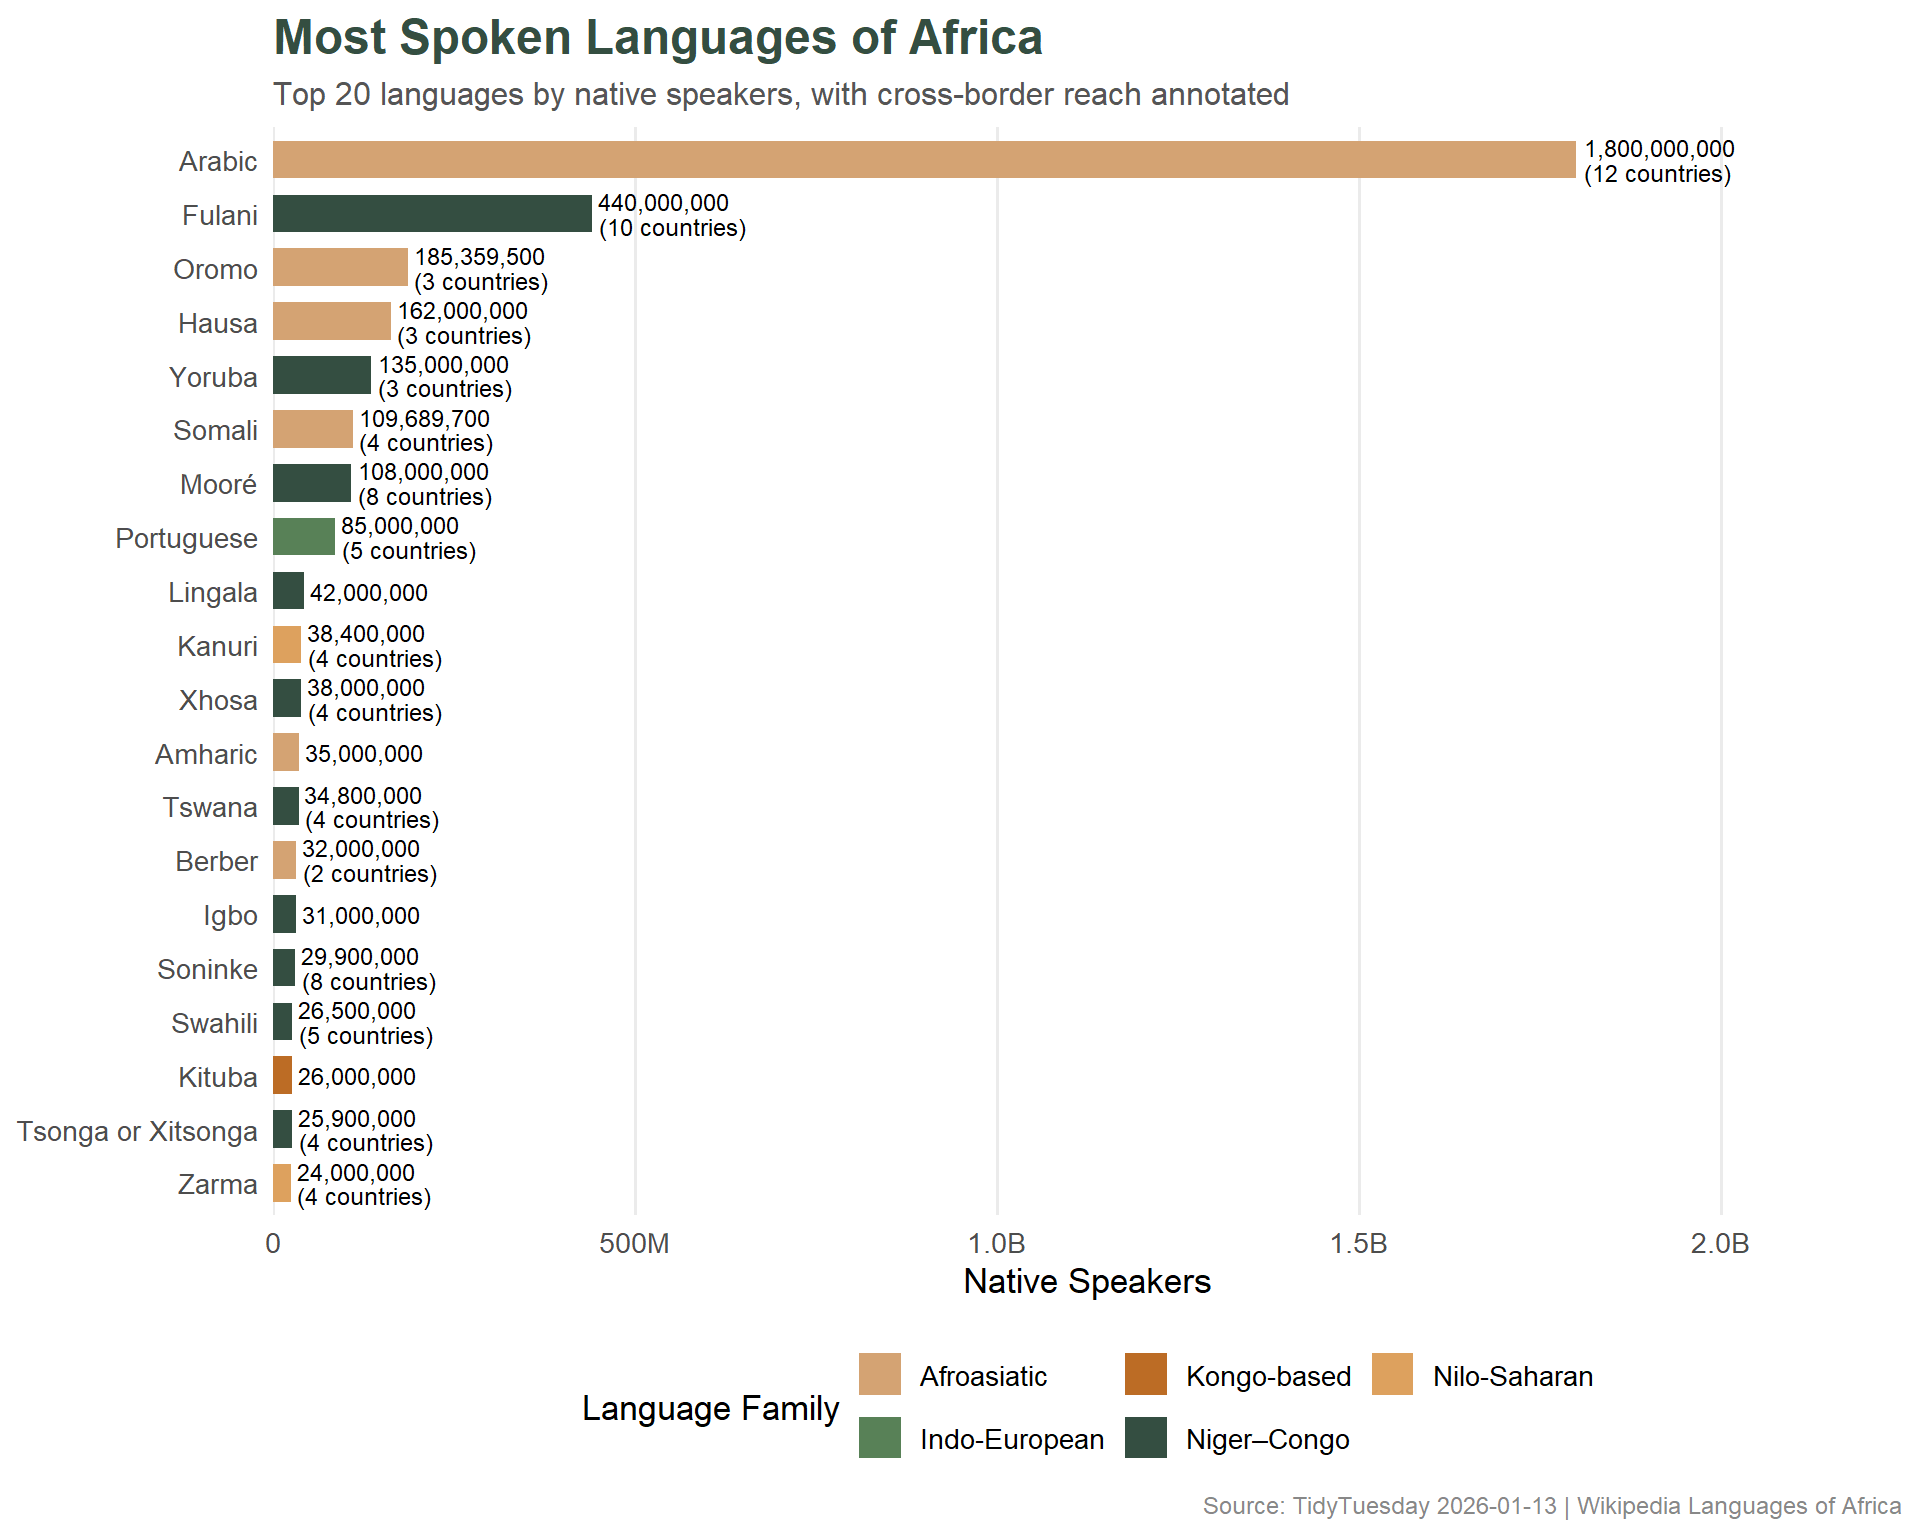
The hero plot shows the top languages by native speakers, colored by language family, with annotations for cross-border languages.

# Warm, earthy African-inspired palette for language families
family_cols <- c(
  "#D4A373",  # warm sand
  "#588157",  # savanna green
  "#BC6C25",  # terracotta
  "#344E41",  # deep forest
  "#DDA15E",  # golden
  "#606C38",  # olive
  "#9B2226",  # deep red
  "#005F73",  # teal
  "#AE2012",  # rust
  "#CA6702"   # amber
)

# Get top 20 languages by native speakers
top_langs <- africa %>%
  group_by(language, family) %>%
  summarize(
    total_speakers = sum(native_speakers, na.rm = TRUE),
    n_countries = n_distinct(country),
    .groups = "drop"
  ) %>%
  arrange(desc(total_speakers)) %>%
  head(20)

# Mark cross-border languages
top_langs <- top_langs %>%
  mutate(cross_border = ifelse(n_countries > 1, paste0(n_countries, " countries"), ""))

ggplot(top_langs, aes(x = reorder(language, total_speakers), y = total_speakers, fill = family)) +
  geom_col(width = 0.7) +
  geom_text(
    aes(label = ifelse(cross_border != "",
                       paste0(scales::comma(total_speakers), "\n(", cross_border, ")"),
                       scales::comma(total_speakers))),
    hjust = -0.05,
    size = 3.2,
    lineheight = 0.85
  ) +
  scale_y_continuous(
    labels = scales::label_number(scale_cut = scales::cut_short_scale()),
    expand = expansion(mult = c(0, 0.25))
  ) +
  scale_fill_manual(values = family_cols, name = "Language Family") +
  coord_flip() +
  labs(
    title = "Most Spoken Languages of Africa",
    subtitle = "Top 20 languages by native speakers, with cross-border reach annotated",
    x = NULL,
    y = "Native Speakers",
    caption = "Source: TidyTuesday 2026-01-13 | Wikipedia Languages of Africa"
  ) +
  theme_minimal(base_size = 13) +
  theme(
    plot.title = element_text(face = "bold", size = 18, color = "#344E41"),
    plot.subtitle = element_text(size = 12, color = "#555555"),
    plot.caption = element_text(size = 9, color = "#888888"),
    legend.position = "bottom",
    panel.grid.major.y = element_blank(),
    panel.grid.minor = element_blank()
  ) +
  guides(fill = guide_legend(nrow = 2))

Final thoughts and takeaways

Africa is the most linguistically diverse continent on Earth, and this dataset — even as a curated subset of the most popular languages — showcases that richness. The dominance of the Niger-Congo and Afro-Asiatic families in terms of both language count and total speakers reflects deep historical patterns of migration and cultural development across the continent.

The cross-border language data is particularly revealing. Languages like Arabic, Swahili, and Hausa don’t respect national boundaries drawn by colonial powers in the 19th and 20th centuries. These lingua francas serve as vital connectors for trade, culture, and communication across regions where dozens of local languages coexist.

Note

This dataset captures only “popular” languages — the full linguistic picture of Africa is far richer. Many languages with fewer speakers are endangered, and the ongoing tension between lingua francas (which enable economic participation) and local languages (which carry cultural heritage) is one of the defining sociolinguistic challenges of the continent.