This dataset contains grant commitments from Science Foundation Ireland (SFI), the Irish government agency responsible for funding scientific research. It includes over 7,200 grants spanning from 2001 to 2025, with information on the funding amount, research institution, programme name, and grant duration. SFI was established under the Programme for Research in Third-Level Institutions (PRTLI) to build Ireland’s capacity in science, technology, engineering, and mathematics (STEM). The data reveals how Ireland has strategically invested in research capacity, shifting from building individual investigator programmes to large-scale research centres and cross-border partnerships.
Loading necessary packages
My handy booster pack that allows me to install (if needed) and load my usual and favorite packages, as well as some helpful functions.
raw <- tidytuesdayR::tt_load("2026-02-24")grants <- raw$sfi_grants %>% janitor::clean_names()
Exploratory Data Analysis
The my_skim() function is a modified version of the skimr::skim() function that returns the number of missing data points (cells as NA) as well as the inverse (e.g.: number of rows that are notNA), the count, minimum, 25%, median, 75%, max, mean, geometric mean, and standard deviation. It also generates a little ASCII histogram. Neat!
SFI Grants
Before skimming, I drop columns that are primarily identifiers or redundant references: proposal_id, research_body_ror_id, funder_name, and crossref_funder_registry_id. The funder name is uniformly “Science Foundation Ireland” and the ROR/Crossref IDs are lookup keys rather than analytical variables.
The EDA reveals a dataset spanning 24+ years of Irish science investment. The current_total_commitment column has a notably right-skewed distribution (mean €574k, median €124k), with a handful of very large grants pulling the average up. There’s also at least one negative value (−€5M), which likely represents a grant amendment or clawback. Start dates run from October 2001 through early 2025, while end dates extend to 2032 — reflecting multi-year research commitments still active today.
# Programme name distributiongrants %>% dplyr::count(programme_name, sort =TRUE) %>%head(15)
# A tibble: 15 × 2
   programme_name                              n
   <chr>                                   <int>
 1 Research Frontiers Programme              888
 2 Discover Programme                        753
 3 Technology Innovation Development Award   504
 4 Conferences and Workshops Programme       492
 5 Principal Investigator Programme          410
 6 UREKA Programme                           408
 7 Frontiers for the Future                  321
 8 Investigator Programme                    282
 9 Maternity/Adoptive Leave Allowance        224
10 Industry Fellowship Programme             198
11 STAR Award                                197
12 Short Term Travel Fellowship              172
13 Research Infrastructure Programme         163
14 Equipment Call                            154
15 Future Innovator Prize                    132
# A tibble: 12 × 2
   research_body                                             n
   <chr>                                                 <int>
 1 Trinity College Dublin (TCD)                           1430
 2 University College Dublin (UCD)                        1398
 3 University College Cork (UCC)                           737
 4 University of Galway                                    722
 5 Dublin City University (DCU)                            513
 6 University of Limerick (UL)                             377
 7 Maynooth University (MU)                                352
 8 Tyndall National Institute (TNI)                        301
 9 RCSI University of Medicine and Health Science (RCSI)   282
10 Technological University Dublin (TU Dublin)             129
11 South East Technological University (SETU)               95
12 The Royal Society - Grant                                86
The top 15 programmes span a wide range: from small travel fellowships and conference grants (dozens of €k) to major Research Centres with €10M+ commitments. The two largest by grant count — Research Frontiers Programme and Discover Programme — represent the “volume end” of SFI’s portfolio: many modest grants to individual researchers. The largest by total euros are the Research Centres Programme and the Principal Investigator Programme.
Who Gets Irish Science Money?
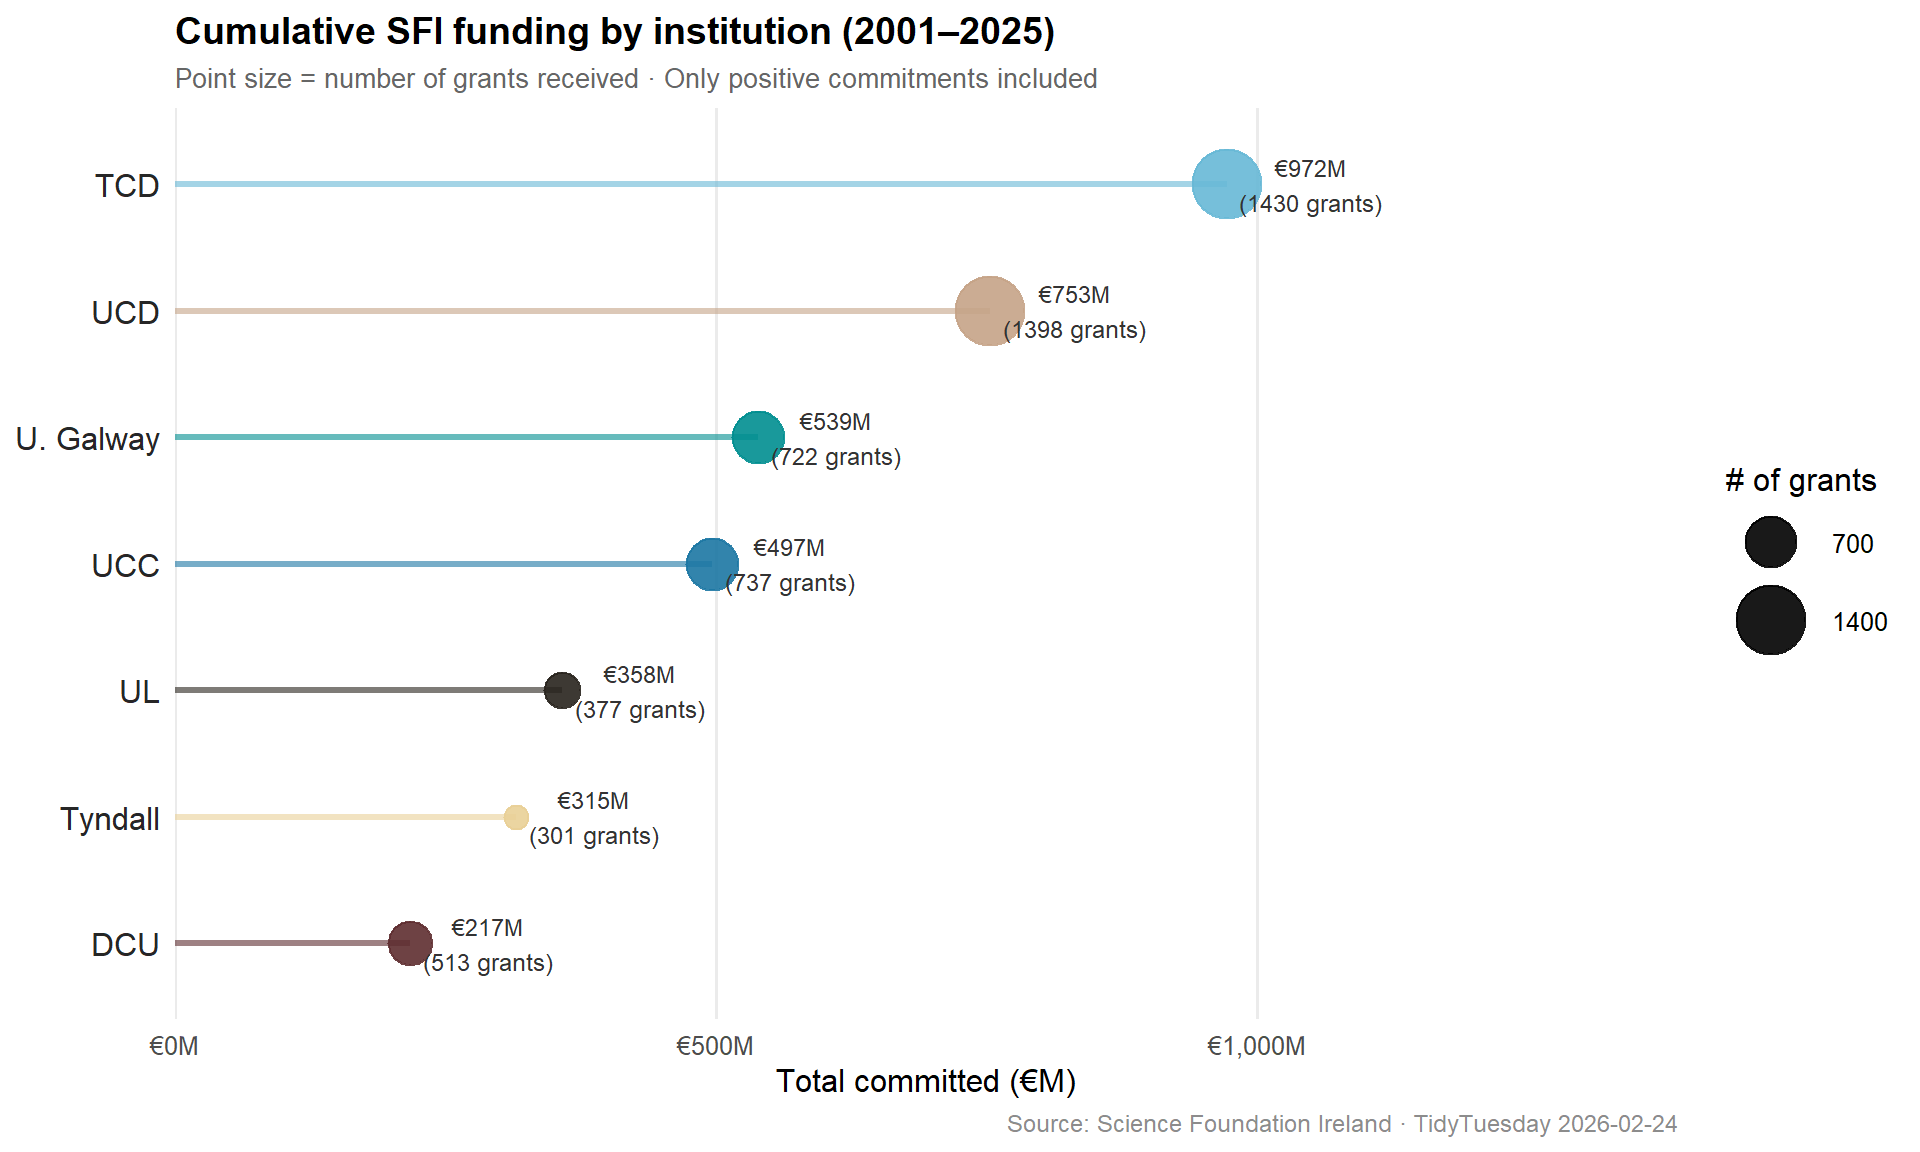
The core story in this data is concentration: a handful of universities absorb the vast majority of SFI funding. Ireland has five traditional research-intensive universities — Trinity College Dublin (TCD), University College Dublin (UCD), University College Cork (UCC), University of Galway, and University of Limerick (UL) — plus a cluster of specialist and newer institutions. Let’s see how the money has moved.
stopifnot("No rows in institution data"=nrow(top_institutions) >0)print(top_institutions)
# A tibble: 7 × 4
  research_body                    n_grants total_m median_k
  <chr>                               <int>   <dbl>    <dbl>
1 Trinity College Dublin (TCD)         1430    972.     157.
2 University College Dublin (UCD)      1398    753.     156.
3 University of Galway                  722    539.     118.
4 University College Cork (UCC)         737    497.     119.
5 University of Limerick (UL)           377    358.     102.
6 Tyndall National Institute (TNI)      301    315.     156.
7 Dublin City University (DCU)          513    217.     108.
# A tibble: 10 × 4
   programme_name                                             n total_m median_k
   <chr>                                                  <int>   <dbl>    <dbl>
 1 Research Centres Programme                                63    996.    7502.
 2 Principal Investigator Programme                         410    594.     996.
 3 Centres for Science Engineering and Technology Progra…    29    313.   12946.
 4 Research Infrastructure Programme                        162    238.    1008.
 5 Investigator Programme                                   267    236.     706.
 6 Frontiers for the Future                                 305    233.     620.
 7 Research Frontiers Programme                             888    167.     194.
 8 Research Professorship Programme                          43    159.    3555.
 9 Strategic Research Cluster Programme                      21    136.    6224.
10 Centres for Research Training (CRT) Programme              6    104.   17455.
NoteAbout Science Foundation Ireland
SFI was established in 2000 as part of the Irish government’s National Development Plan, with a mandate to fund strategic basic and applied research in STEM. Ireland’s Celtic Tiger boom of the late 1990s–2000s created the fiscal conditions for a major research investment push. By building on its existing university infrastructure, Ireland aimed to transition from a foreign direct investment–driven economy to a knowledge economy — with SFI as the primary lever. The data here begins in 2001, the first full year of operations.
ImportantNotable finding
A single programme — Research Centres (64 grants) — accounts for nearly €1 billion in commitments, roughly 23% of all positive funding in the dataset. These large multi-year consortia, designed to bring industry and academia together, dwarf individual investigator grants in scale. The median Research Centres grant is €4.6 million versus €124,000 across the full portfolio.
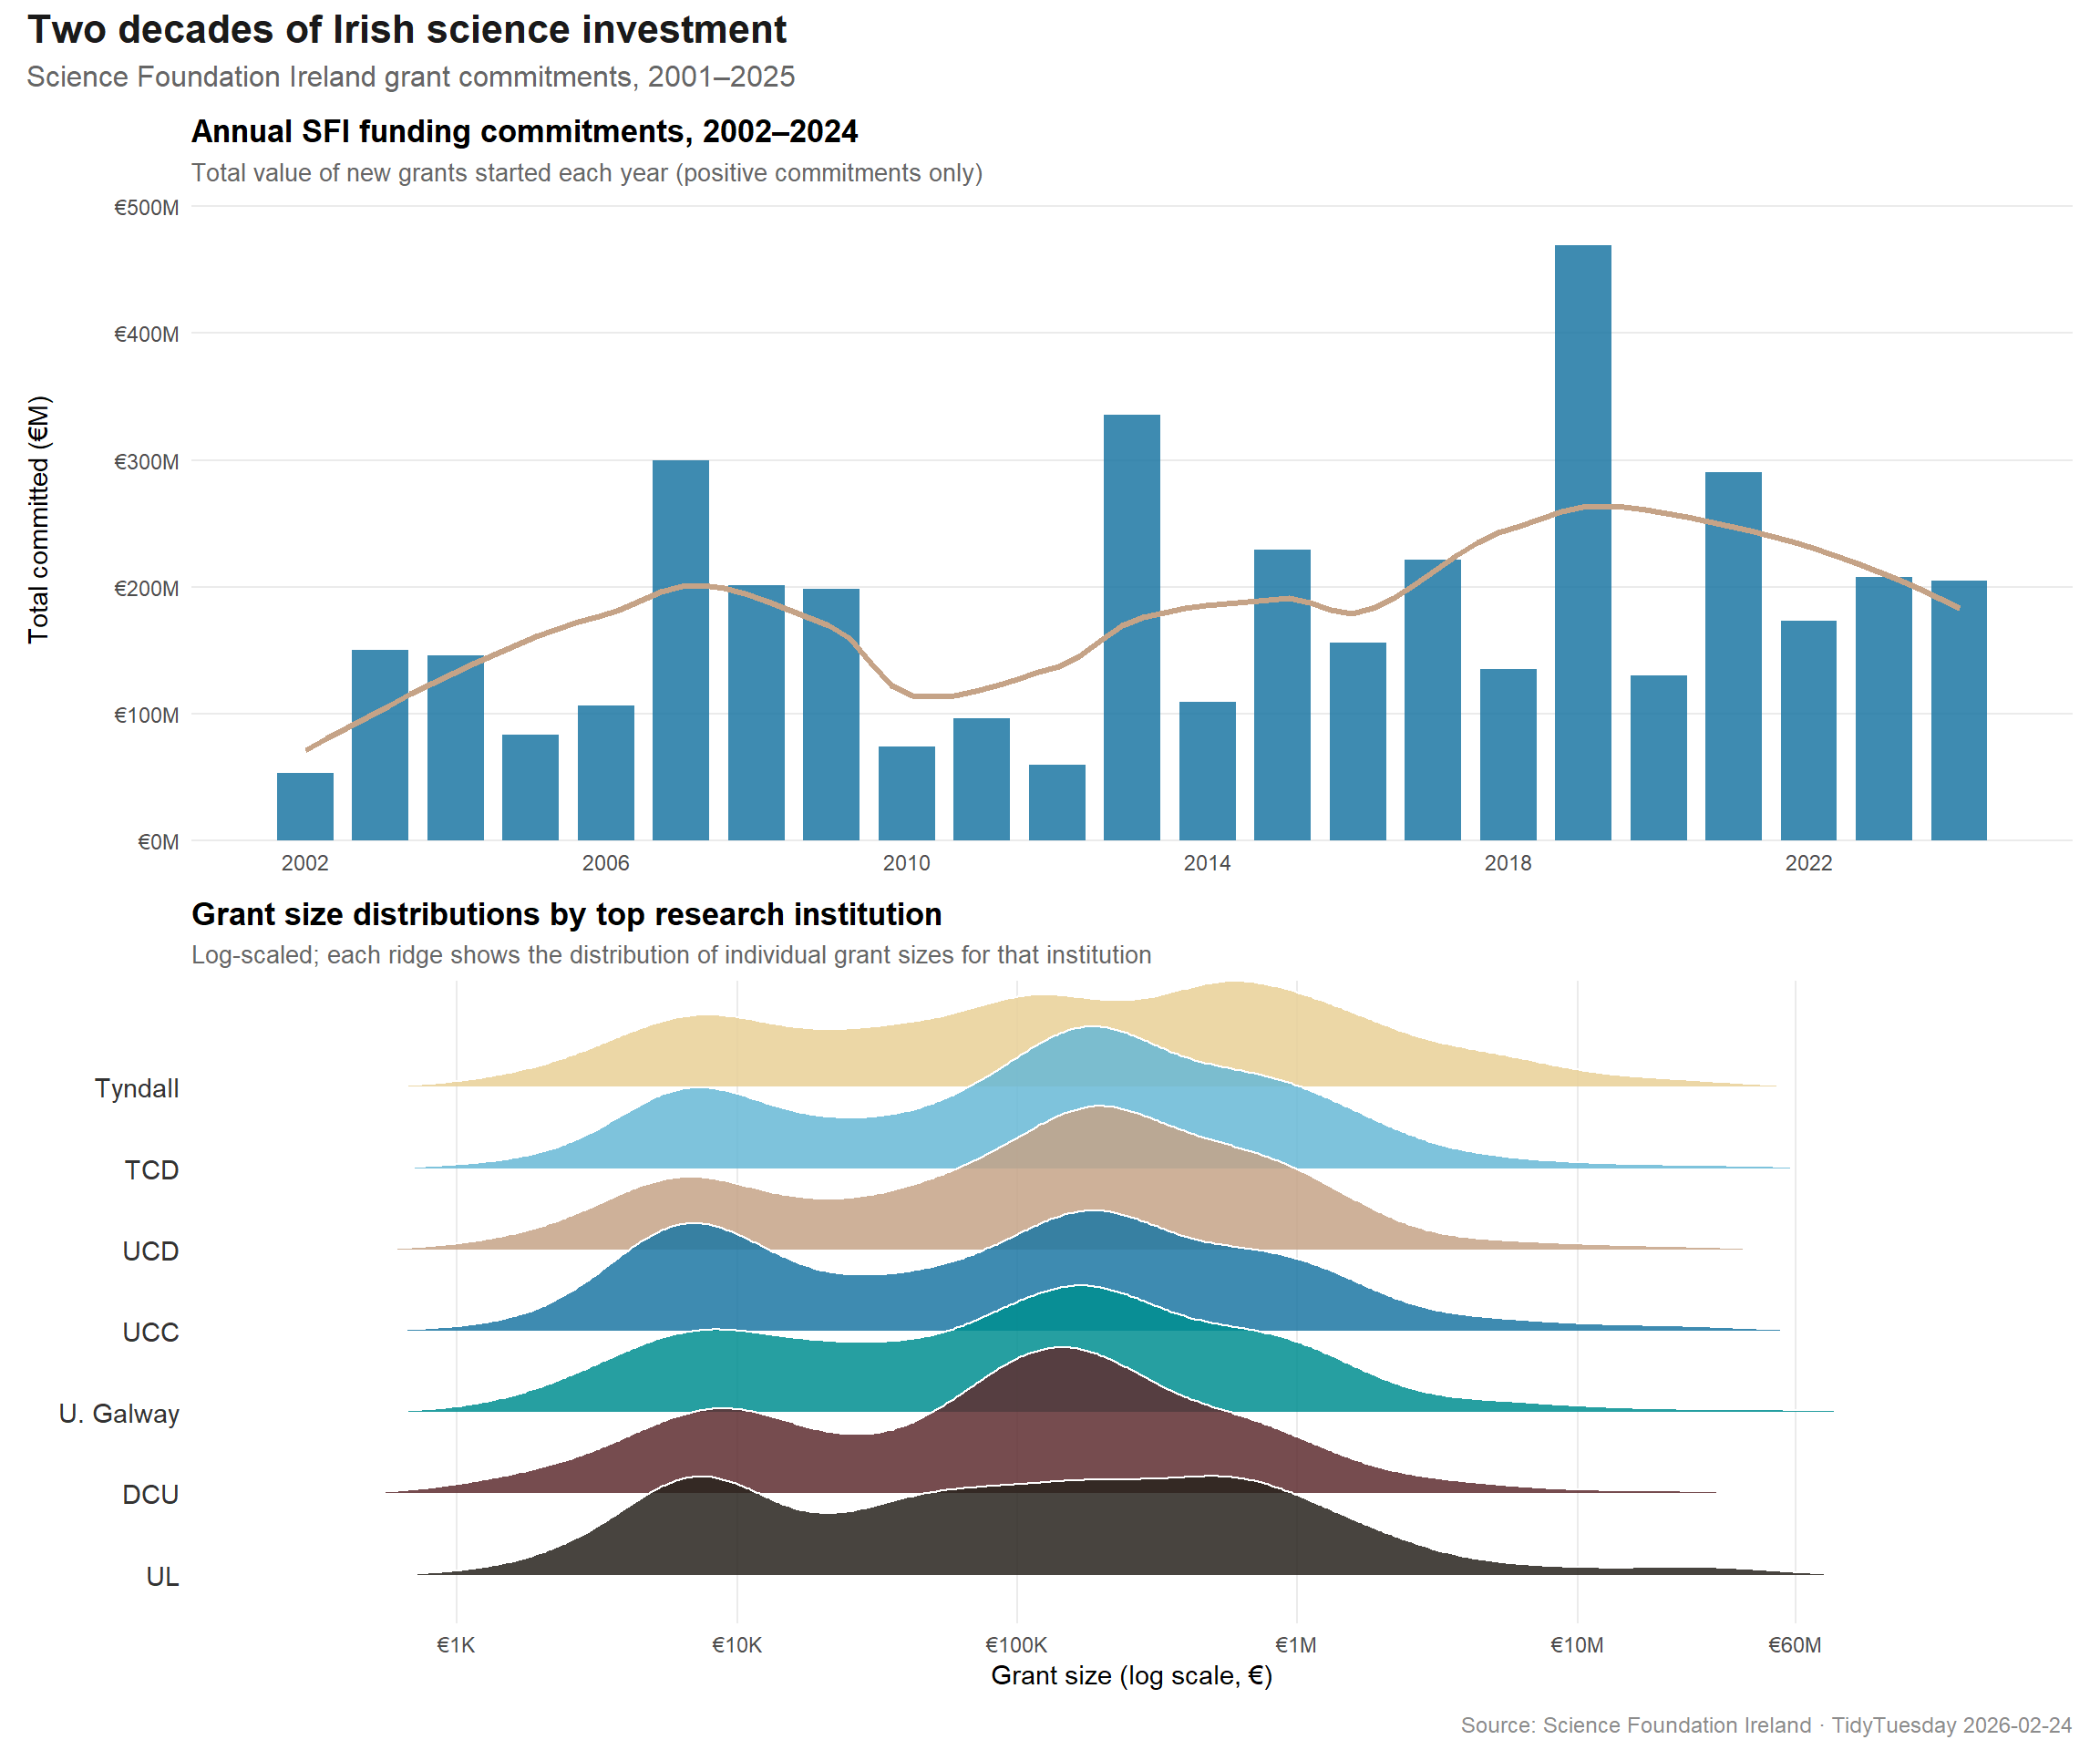
Grant size distribution by institution
The ridgeline plot below shows how grant size distributions differ markedly across the top seven research bodies. Institutions with strong research centre activity show fat right tails; those relying more on small grants cluster near the lower end.
# Clean institution names for displaytop7_names <- top_institutions$research_bodyridge_data <- grants %>% dplyr::filter( current_total_commitment >1000, # exclude negligible/negative research_body %in% top7_names ) %>%mutate(# Shorten institution names for displayinstitution_label =case_when( research_body =="Trinity College Dublin (TCD)"~"TCD", research_body =="University College Dublin (UCD)"~"UCD", research_body =="University of Galway"~"U. Galway", research_body =="University College Cork (UCC)"~"UCC", research_body =="University of Limerick (UL)"~"UL", research_body =="Tyndall National Institute (TNI)"~"Tyndall", research_body =="Dublin City University (DCU)"~"DCU",TRUE~ research_body ),# Reorder by median grant sizeinstitution_label = forcats::fct_reorder(institution_label, current_total_commitment, .fun = median) )cat(sprintf("Ridge data: %d rows, %d cols\n", nrow(ridge_data), ncol(ridge_data)))
Ridge data: 5467 rows, 13 cols
stopifnot("Ridge data is empty"=nrow(ridge_data) >0)# Quick sanity check: are there multiple distinct grant values per institution?sanity <- ridge_data %>%group_by(institution_label) %>%summarise(n_distinct = dplyr::n_distinct(current_total_commitment), .groups ="drop")print(sanity)
# Palette: ghibli::MarnieMedium1 (7 qualitative colors — not previously used)institution_palette <- paletteer::paletteer_d("ghibli::MarnieMedium1")# Assign colours to institutions in order of the ridge factor levelsinst_levels <-levels(ridge_data$institution_label)names(institution_palette) <- inst_levelscat("Using palette: ghibli::MarnieMedium1\n")
# --- Plot 1: Funding by year ---p_time <- ggplot2::ggplot(funding_by_year, ggplot2::aes(x = year, y = total_funding_m)) + ggplot2::geom_col(fill ="#1C77A3FF", width =0.75, alpha =0.85) + ggplot2::geom_smooth( ggplot2::aes(group =1),method ="loess", span =0.5, se =FALSE,colour ="#C5A387FF", linewidth =1.2 ) + ggplot2::scale_x_continuous(breaks =seq(2002, 2024, by =4)) + ggplot2::scale_y_continuous(labels = scales::label_dollar(prefix ="€", suffix ="M"),expand = ggplot2::expansion(mult =c(0, 0.08)) ) + ggplot2::labs(title ="Annual SFI funding commitments, 2002–2024",subtitle ="Total value of new grants started each year (positive commitments only)",x =NULL,y ="Total committed (€M)" ) + ggplot2::theme_minimal(base_size =11) + ggplot2::theme(plot.title = ggplot2::element_text(face ="bold", size =13),plot.subtitle = ggplot2::element_text(colour ="grey40", size =10),panel.grid.minor = ggplot2::element_blank(),panel.grid.major.x = ggplot2::element_blank(),axis.text = ggplot2::element_text(colour ="grey30") )# --- Plot 2: Grant size ridgeline by institution ---p_ridge <- ggplot2::ggplot( ridge_data, ggplot2::aes(x = current_total_commitment,y = institution_label,fill = institution_label )) + ggridges::geom_density_ridges(scale =1.8,rel_min_height =0.01,alpha =0.85,colour ="white",linewidth =0.4 ) + ggplot2::scale_x_log10(labels = scales::label_dollar(prefix ="€", scale_cut = scales::cut_short_scale()),breaks =c(1e3, 1e4, 1e5, 1e6, 1e7, 6e7) ) + ggplot2::scale_fill_manual(values = institution_palette, guide ="none") + ggplot2::labs(title ="Grant size distributions by top research institution",subtitle ="Log-scaled; each ridge shows the distribution of individual grant sizes for that institution",x ="Grant size (log scale, €)",y =NULL ) + ggplot2::theme_minimal(base_size =11) + ggplot2::theme(plot.title = ggplot2::element_text(face ="bold", size =13),plot.subtitle = ggplot2::element_text(colour ="grey40", size =10),panel.grid.minor = ggplot2::element_blank(),panel.grid.major.y = ggplot2::element_blank(),axis.text.y = ggplot2::element_text(colour ="grey20", size =11),axis.text.x = ggplot2::element_text(colour ="grey30") )# --- Combined layout ---p_combined <- (p_time / p_ridge) + patchwork::plot_annotation(title ="Two decades of Irish science investment",subtitle ="Science Foundation Ireland grant commitments, 2001–2025",caption ="Source: Science Foundation Ireland · TidyTuesday 2026-02-24",theme = ggplot2::theme(plot.title = ggplot2::element_text(face ="bold", size =16, colour ="grey10"),plot.subtitle = ggplot2::element_text(colour ="grey40", size =12),plot.caption = ggplot2::element_text(colour ="grey55", size =9) ) )p_combined
# Lollipop of top 7 institutions by total fundinglollipop_data <- top_institutions %>%mutate(institution_label =case_when( research_body =="Trinity College Dublin (TCD)"~"TCD", research_body =="University College Dublin (UCD)"~"UCD", research_body =="University of Galway"~"U. Galway", research_body =="University College Cork (UCC)"~"UCC", research_body =="University of Limerick (UL)"~"UL", research_body =="Tyndall National Institute (TNI)"~"Tyndall", research_body =="Dublin City University (DCU)"~"DCU",TRUE~ research_body ),institution_label = forcats::fct_reorder(institution_label, total_m) )p_lollipop <- ggplot2::ggplot(lollipop_data, ggplot2::aes(x = total_m, y = institution_label, colour = institution_label)) + ggplot2::geom_segment( ggplot2::aes(x =0, xend = total_m, y = institution_label, yend = institution_label),linewidth =1.2, alpha =0.6 ) + ggplot2::geom_point(ggplot2::aes(size = n_grants), alpha =0.9) + ggrepel::geom_text_repel( ggplot2::aes(label =sprintf("€%.0fM\n(%d grants)", total_m, n_grants) ),nudge_x =20,size =3.2,colour ="grey20",segment.colour ="grey70",min.segment.length =0.2 ) + ggplot2::scale_colour_manual(values = institution_palette, guide ="none") + ggplot2::scale_size_continuous(name ="# of grants",range =c(4, 12),breaks =c(300, 700, 1400) ) + ggplot2::scale_x_continuous(labels = scales::label_dollar(prefix ="€", suffix ="M"),expand = ggplot2::expansion(mult =c(0, 0.4)) ) + ggplot2::labs(title ="Cumulative SFI funding by institution (2001–2025)",subtitle ="Point size = number of grants received · Only positive commitments included",x ="Total committed (€M)",y =NULL,caption ="Source: Science Foundation Ireland · TidyTuesday 2026-02-24" ) + ggplot2::theme_minimal(base_size =12) + ggplot2::theme(plot.title = ggplot2::element_text(face ="bold", size =14),plot.subtitle = ggplot2::element_text(colour ="grey40", size =10),plot.caption = ggplot2::element_text(colour ="grey55", size =9),panel.grid.minor = ggplot2::element_blank(),panel.grid.major.y = ggplot2::element_blank(),axis.text.y = ggplot2::element_text(colour ="grey15", size =12),legend.position ="right" )p_lollipop
Final thoughts and takeaways
Over 24 years, Science Foundation Ireland has committed more than €4 billion to scientific research, and the data tells a clear story about strategy, concentration, and institutional hierarchy.
The funding is deeply concentrated. Trinity College Dublin and University College Dublin together account for roughly €1.7 billion — 40% of all positive commitments — despite Ireland having seven research universities and dozens of institutes. This isn’t a flaw in the system; SFI’s explicit strategy was to build world-class research capacity at the institutions best positioned to compete internationally. TCD and UCD had the critical mass, the international networks, and the physical infrastructure to absorb and deploy large-scale investment effectively.
Programme design drives the size distribution. The bimodal character visible in the ridgeline plots — a cluster of small grants and a long right tail of very large ones — reflects deliberate programme architecture. Small grants (~€10k–€200k) fund conferences, student internships, travel fellowships, and starter investigator awards. Large grants (€1M–€60M) fund Research Centres, Strategic Research Clusters, and the flagship Principal Investigator Programme. The Tyndall National Institute stands out: its grants cluster at the higher end because Tyndall is a specialist semiconductor and photonics institute that attracts infrastructure-scale investment.
Funding spiked in 2019. The €468M committed in 2019 is the single largest annual figure in the dataset — nearly double 2018’s total. This reflects the SFI Research Centres Programme’s second call cycle, where a cohort of large multi-year centres were renewed and expanded simultaneously. Peaks like this are an artifact of how multi-year commitments are recorded at grant start rather than amortised over the grant period.
The post-2011 dip is real. Ireland’s austerity years (2010–2013) are visible in the data. While the count of grants held up partially — driven by small-ticket programmes that were cheaper to maintain — the total committed euros declined substantially from the Celtic Tiger–era peaks. The recovery from 2013 onward has been sustained, with the exchequer re-committing to science as a pillar of the post-recession economic model.
One caveat: the current_total_commitment field reflects the most recent recorded amount for each grant, which can be amended over time. The small number of negative values (grant reductions or clawbacks) are not included in totals here. The picture is of commitment, not necessarily of money actually disbursed.