
Tidy Tuesday: Repair Cafes Worldwide
tidytuesday
R
sustainability
repair
Exploring repair success rates and failure modes across product categories at repair cafes worldwide.
Preface
From TidyTuesday repository.
Repair Cafes are free meeting places where visitors can bring their broken items to be repaired by skilled volunteers. This dataset comes from the Repair Cafe Foundation and covers repairs logged from hundreds of cafes worldwide, including the item category, repair outcome, and failure reasons when a repair could not be completed.
Loading necessary packages
My handy booster pack that allows me to install (if needed) and load my usual and favorite packages, as well as some helpful functions.
Code
# Packages ----------------------------------------------------------------

{
  # Install pak if it's not already installed
  if (!requireNamespace("pak", quietly = TRUE)) {
    install.packages("pak", repos = "https://cloud.r-project.org")
  }

  # CRAN Packages ----
  install_booster_pack <- function(package, load = TRUE) {
    for (pkg in package) {
      if (!requireNamespace(pkg, quietly = TRUE)) {
        pak::pkg_install(pkg)
      }
      if (load) {
        library(pkg, character.only = TRUE)
      }
    }
  }

  core_packages <- c(
    'fs',
    'here',
    'janitor',
    'rio',
    'tidyverse',
    'skimr',
    'paletteer',
    'tidytuesdayR'
  )

  optional_packages <- c('ggtext', 'glue')

  install_booster_pack(package = unique(c(core_packages, optional_packages)), load = TRUE)
  rm(install_booster_pack, core_packages, optional_packages)

  # Custom Functions ----

  `%ni%` <- Negate(`%in%`)

  geometric_mean <- function(x) {
    exp(mean(log(x[x > 0]), na.rm = TRUE))
  }

  my_skim <- skim_with(
    numeric = sfl(
      n = length,
      min = ~ min(.x, na.rm = T),
      p25 = ~ stats::quantile(., probs = .25, na.rm = TRUE, names = FALSE),
      med = ~ median(.x, na.rm = T),
      p75 = ~ stats::quantile(., probs = .75, na.rm = TRUE, names = FALSE),
      max = ~ max(.x, na.rm = T),
      mean = ~ mean(.x, na.rm = T),
      geo_mean = ~ geometric_mean(.x),
      sd = ~ stats::sd(., na.rm = TRUE),
      hist = ~ inline_hist(., 5)
    ),
    append = FALSE
  )
}
Load raw data from package
raw <- tidytuesdayR::tt_load('2026-04-07')

repairs      <- raw$repairs
repairs_text <- raw$repairs_text
Exploratory Data Analysis
The my_skim() function is a modified version of the skimr::skim() function that returns the number of missing data points (cells as NA) as well as the inverse (e.g.: number of rows that are not NA), the count, minimum, 25%, median, 75%, max, mean, geometric mean, and standard deviation. It also generates a little ASCII histogram. Neat!
repairs
my_skim(repairs)| Name | repairs |
| Number of rows | 178749 |
| Number of columns | 11 |
| _______________________ | |
| Column type frequency: | |
| character | 7 |
| Date | 1 |
| numeric | 3 |
| ________________________ | |
| Group variables | None |
Variable type: character
| skim_variable | n_missing | complete_rate | min | max | empty | n_unique | whitespace |
|---|---|---|---|---|---|---|---|
| repair_id | 0 | 1 | 16 | 25 | 0 | 178716 | 0 |
| repair_cafe_name | 5 | 1 | 3 | 46 | 0 | 447 | 0 |
| country | 0 | 1 | 2 | 2 | 0 | 25 | 0 |
| kind_of_product | 35 | 1 | 3 | 52 | 0 | 1951 | 0 |
| category | 5 | 1 | 5 | 33 | 0 | 14 | 0 |
| brand | 147 | 1 | 2 | 38 | 0 | 8600 | 0 |
| repaired | 2 | 1 | 2 | 4 | 0 | 4 | 0 |
Variable type: Date
| skim_variable | n_missing | complete_rate | min | max | median | n_unique |
|---|---|---|---|---|---|---|
| repair_date | 0 | 1 | 2015-04-04 | 2026-08-07 | 2024-01-31 | 2582 |
Variable type: numeric
| skim_variable | n_missing | complete_rate | n | min | p25 | med | p75 | max | mean | geo_mean | sd | hist |
|---|---|---|---|---|---|---|---|---|---|---|---|---|
| repair_cafe_number | 5 | 1.00 | 178749 | 2 | 50 | 300 | 541 | 997 | 321.11 | 150.34 | 274.97 | ▇▃▃▃▁ |
| estimated_year_of_production | 114383 | 0.36 | 178749 | -6 | 2002 | 2014 | 2019 | 2100 | 2000.21 | 2007.29 | 124.58 | ▁▁▁▁▇ |
| repairability | 53885 | 0.70 | 178749 | 0 | 5 | 7 | 9 | 10 | 6.66 | 5.79 | 2.74 | ▃▃▅▇▇ |
# Check exact values in key categorical columns before any filtering
cat("\n--- repaired column values ---\n")
--- repaired column values ---repairs |> count(repaired, sort = TRUE) |> print()# A tibble: 5 × 2
repaired n
<chr> <int>
1 yes 112775
2 no 43112
3 half 22859
4 <NA> 2
5 ja 1cat("\n--- category column values ---\n")
--- category column values ---repairs |> count(category, sort = TRUE) |> print()# A tibble: 15 × 2
category n
<chr> <int>
1 Household appliances electric 70983
2 Textile 24412
3 Display and sound equipment 20415
4 Other 10435
5 Tools electric 10340
6 Computer equipment / phones 9488
7 Clocks / alarm clocks 7016
8 Bicycles 6252
9 Household appliances non-electric 5593
10 Tools non-electric 4178
11 Jewelry 2852
12 Toys electric 2645
13 Furniture 2120
14 Toys non-electric 2015
15 <NA> 5cat("\n--- country column values ---\n")
--- country column values ---repairs |> count(country, sort = TRUE) |> print(n = 30)# A tibble: 25 × 2
country n
<chr> <int>
1 NL 90839
2 GB 37692
3 FR 19724
4 CA 7642
5 AU 7079
6 DE 4509
7 US 3585
8 BE 1975
9 ES 1711
10 IL 1559
11 AT 1248
12 NZ 437
13 IE 242
14 IT 139
15 FI 107
16 TW 78
17 LI 56
18 PT 31
19 GF 27
20 LU 26
21 KR 23
22 ZA 13
23 HK 4
24 CH 2
25 SE 1repairs_text
my_skim(repairs_text)| Name | repairs_text |
| Number of rows | 178749 |
| Number of columns | 12 |
| _______________________ | |
| Column type frequency: | |
| character | 12 |
| ________________________ | |
| Group variables | None |
Variable type: character
| skim_variable | n_missing | complete_rate | min | max | empty | n_unique | whitespace |
|---|---|---|---|---|---|---|---|
| repair_id | 0 | 1.00 | 16 | 25 | 0 | 178716 | 0 |
| model | 115064 | 0.36 | 1 | 132 | 0 | 37802 | 0 |
| defect_found | 30903 | 0.83 | 1 | 255 | 0 | 80236 | 0 |
| problem_description | 52079 | 0.71 | 1 | 900 | 0 | 80694 | 0 |
| repair_method | 94499 | 0.47 | 1 | 5943 | 0 | 57198 | 0 |
| partial_repair_notes | 159497 | 0.11 | 1 | 1304 | 0 | 17715 | 0 |
| failure_reasons | 152047 | 0.15 | 12 | 43 | 0 | 10 | 0 |
| failure_reason_open | 172417 | 0.04 | 1 | 328 | 0 | 5051 | 0 |
| used_repair_info | 69912 | 0.61 | 2 | 7 | 0 | 3 | 0 |
| repair_info_source | 175339 | 0.02 | 1 | 629 | 0 | 1627 | 0 |
| repair_info_url | 173200 | 0.03 | 4 | 23 | 0 | 25 | 0 |
| suggestions | 173169 | 0.03 | 1 | 790 | 0 | 4832 | 0 |
cat("\n--- failure_reasons column values ---\n")
--- failure_reasons column values ---repairs_text |> count(failure_reasons, sort = TRUE) |> print()# A tibble: 11 × 2
failure_reasons n
<chr> <int>
1 <NA> 152047
2 No way to fix the product 5563
3 Spare parts not available at repair session 4750
4 Unidentified failure 3676
5 Too worn out 3352
6 No way to open the product 2311
7 Spare parts not available on the market 2190
8 Spare parts too expensive 2179
9 Too time consuming 1233
10 Lack of equipment at repair location 878
11 Repair information not available 570The repairs table has ~179,000 repair records spanning hundreds of repair cafes worldwide. The dominant countries are the Netherlands (NL, ~91k records), Great Britain (GB, ~38k), and France (FR, ~20k), reflecting where the Repair Cafe movement originated. The repaired column uses “yes”, “no”, and “half” as its primary outcome values, with a small number of “ja” entries (Dutch for “yes”). The repairability score runs 0–10 and is missing for roughly a third of records.
Repair Success by Product Category
The core question for any repair cafe visitor is: “What are my chances of walking out with a fixed item?” I look at repair outcomes across all product categories, normalizing for the mix of “yes”, “half”, and “no” results. The “half” outcome — a partial fix — is treated as a mid-point rather than a failure.
# Normalize repaired values: treat "ja" (Dutch yes) as "yes"
repairs_clean <- repairs |>
  mutate(
    repaired_norm = case_when(
      repaired %in% c("yes", "ja") ~ "Repaired",
      repaired == "half"           ~ "Partial",
      repaired == "no"             ~ "Not repaired",
      TRUE                         ~ NA_character_
    )
  ) |>
  filter(!is.na(category), !is.na(repaired_norm))

# Verify we have data
stopifnot(nrow(repairs_clean) > 0)
cat("Rows after cleaning:", nrow(repairs_clean), "\n")
Rows after cleaning: 178742 # Count outcomes per category
category_outcomes <- repairs_clean |>
count(category, repaired_norm) |>
group_by(category) |>
mutate(
total = sum(n),
pct = n / total
) |>
ungroup()
# Verify
stopifnot(nrow(category_outcomes) > 0)
cat("Categories x outcomes:\n")Categories x outcomes:print(category_outcomes)# A tibble: 42 × 5
category repaired_norm n total pct
<chr> <chr> <int> <int> <dbl>
1 Bicycles Not repaired 571 6252 0.0913
2 Bicycles Partial 576 6252 0.0921
3 Bicycles Repaired 5105 6252 0.817
4 Clocks / alarm clocks Not repaired 1656 7016 0.236
5 Clocks / alarm clocks Partial 1035 7016 0.148
6 Clocks / alarm clocks Repaired 4325 7016 0.616
7 Computer equipment / phones Not repaired 2802 9488 0.295
8 Computer equipment / phones Partial 2285 9488 0.241
9 Computer equipment / phones Repaired 4401 9488 0.464
10 Display and sound equipment Not repaired 7368 20414 0.361
# ℹ 32 more rows# Order categories by % fully repaired
cat_order <- category_outcomes |>
filter(repaired_norm == "Repaired") |>
arrange(pct) |>
pull(category)
category_outcomes <- category_outcomes |>
mutate(category = factor(category, levels = cat_order))pal_colors <- as.character(paletteer::paletteer_d("lisa::OskarSchlemmer", n = 5))
# Assign outcome colors: Repaired = warm gold, Partial = mid blue-purple, Not repaired = dark red
outcome_colors <- c(
"Repaired" = pal_colors[3], # DABD61 warm gold
"Partial" = pal_colors[2], # 8785B2 muted purple
"Not repaired" = pal_colors[5] # BE3428 warm red
)
p <- ggplot(
category_outcomes,
aes(x = pct, y = category, fill = repaired_norm)
) +
geom_col(width = 0.7, position = "stack") +
scale_x_continuous(
labels = scales::percent_format(accuracy = 1),
expand = expansion(mult = c(0, 0.02))
) +
scale_fill_manual(
values = outcome_colors,
breaks = c("Repaired", "Partial", "Not repaired"),
name = "Outcome"
) +
geom_vline(xintercept = 0.5, linetype = "dashed", color = "grey40", linewidth = 0.5) +
labs(
title = "Repair success rates at repair cafes worldwide",
subtitle = "Share of items fully repaired, partially fixed, or not repaired — by product category",
x = "Share of repairs",
y = NULL,
caption = "Source: Repair Cafe Foundation via TidyTuesday 2026-04-07 | 'half' outcomes treated as partial fixes"
) +
theme_minimal(base_size = 13) +
theme(
plot.title = element_text(face = "bold", size = 15),
plot.subtitle = element_text(color = "grey30", size = 11, margin = margin(b = 10)),
plot.caption = element_text(color = "grey50", size = 9, hjust = 0),
legend.position = "top",
legend.title = element_text(face = "bold"),
panel.grid.major.y = element_blank(),
panel.grid.minor = element_blank(),
axis.text.y = element_text(size = 11)
)
p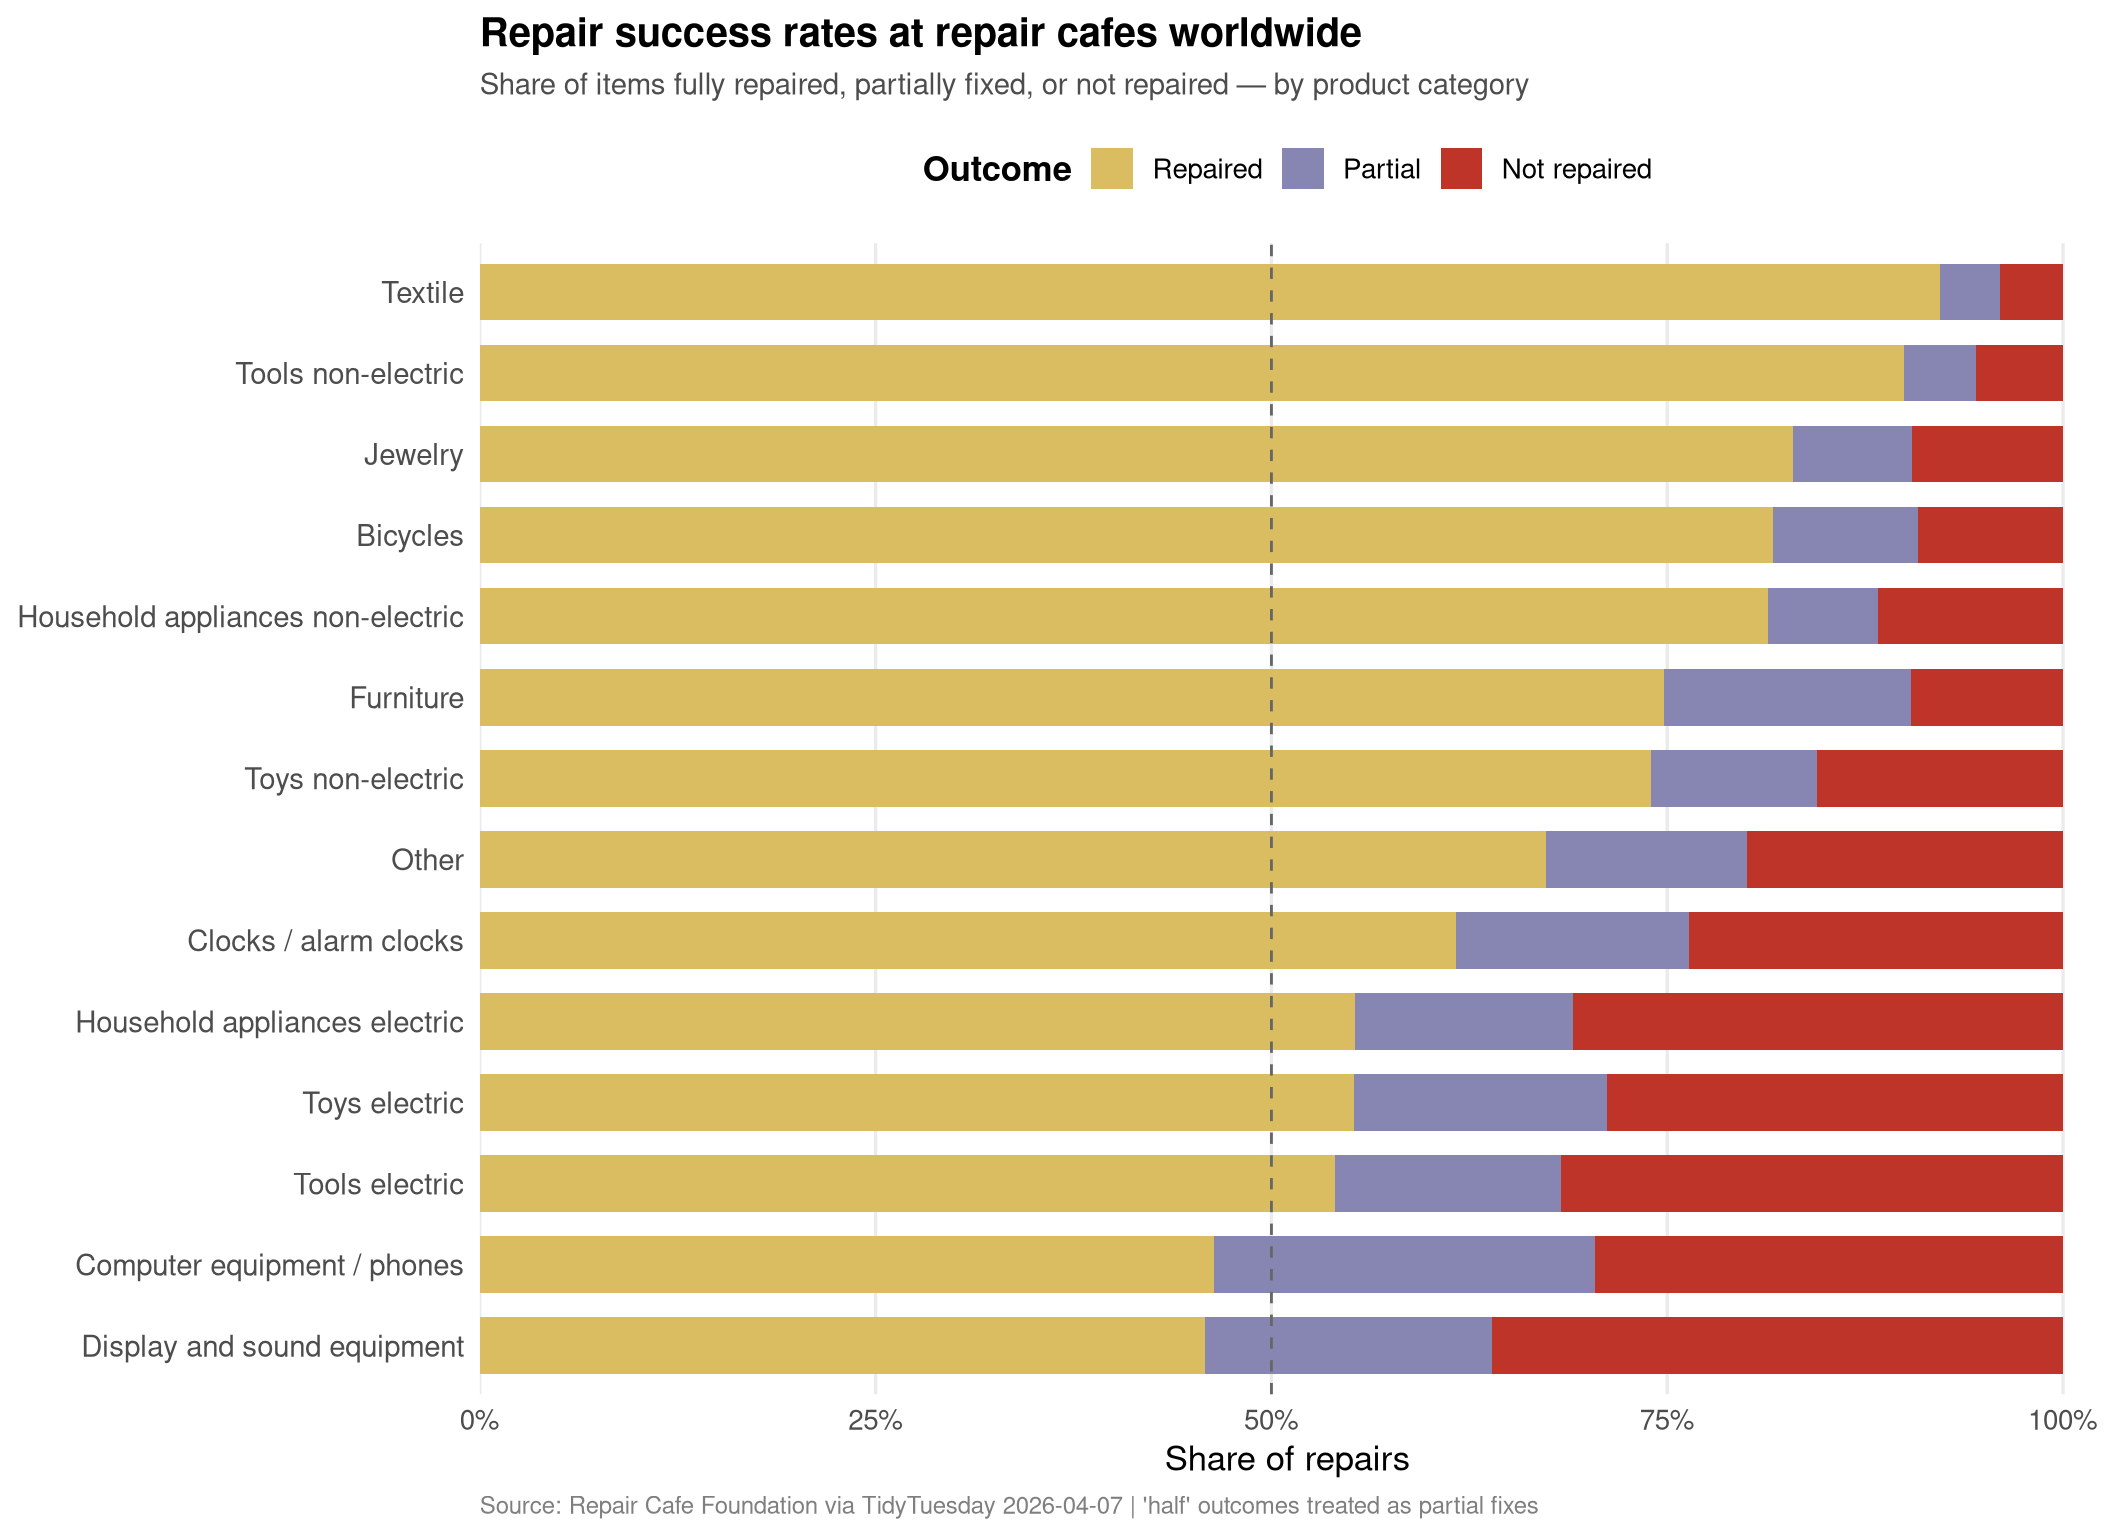
# Join repairs with repairs_text to get failure reasons
repairs_with_text <- repairs |>
  inner_join(repairs_text |> select(repair_id, failure_reasons), by = "repair_id") |>
  filter(!is.na(failure_reasons), !is.na(category))

stopifnot(nrow(repairs_with_text) > 0)
cat("Rows with failure reasons:", nrow(repairs_with_text), "\n")
Rows with failure reasons: 26720 # Top failure reasons overall
failure_summary <- repairs_with_text |>
count(failure_reasons, sort = TRUE) |>
filter(failure_reasons != "NA") |>
slice_max(n, n = 9) |>
mutate(
failure_reasons = str_wrap(failure_reasons, width = 35),
failure_reasons = fct_reorder(failure_reasons, n)
)
stopifnot(nrow(failure_summary) > 0)
pal_fail <- as.character(paletteer::paletteer_d("lisa::OskarSchlemmer", n = 5))
p2 <- ggplot(failure_summary, aes(x = n, y = failure_reasons, fill = n)) +
geom_col(width = 0.7, show.legend = FALSE) +
scale_fill_gradient(low = pal_fail[2], high = pal_fail[4]) +
scale_x_continuous(
labels = scales::comma,
expand = expansion(mult = c(0, 0.05))
) +
labs(
title = "Why do repairs fail at repair cafes?",
subtitle = "Most common logged reasons when a repair could not be completed",
x = "Number of repair records",
y = NULL,
caption = "Source: Repair Cafe Foundation via TidyTuesday 2026-04-07"
) +
theme_minimal(base_size = 13) +
theme(
plot.title = element_text(face = "bold", size = 15),
plot.subtitle = element_text(color = "grey30", size = 11, margin = margin(b = 10)),
plot.caption = element_text(color = "grey50", size = 9, hjust = 0),
panel.grid.major.y = element_blank(),
panel.grid.minor = element_blank(),
axis.text.y = element_text(size = 11)
)
p2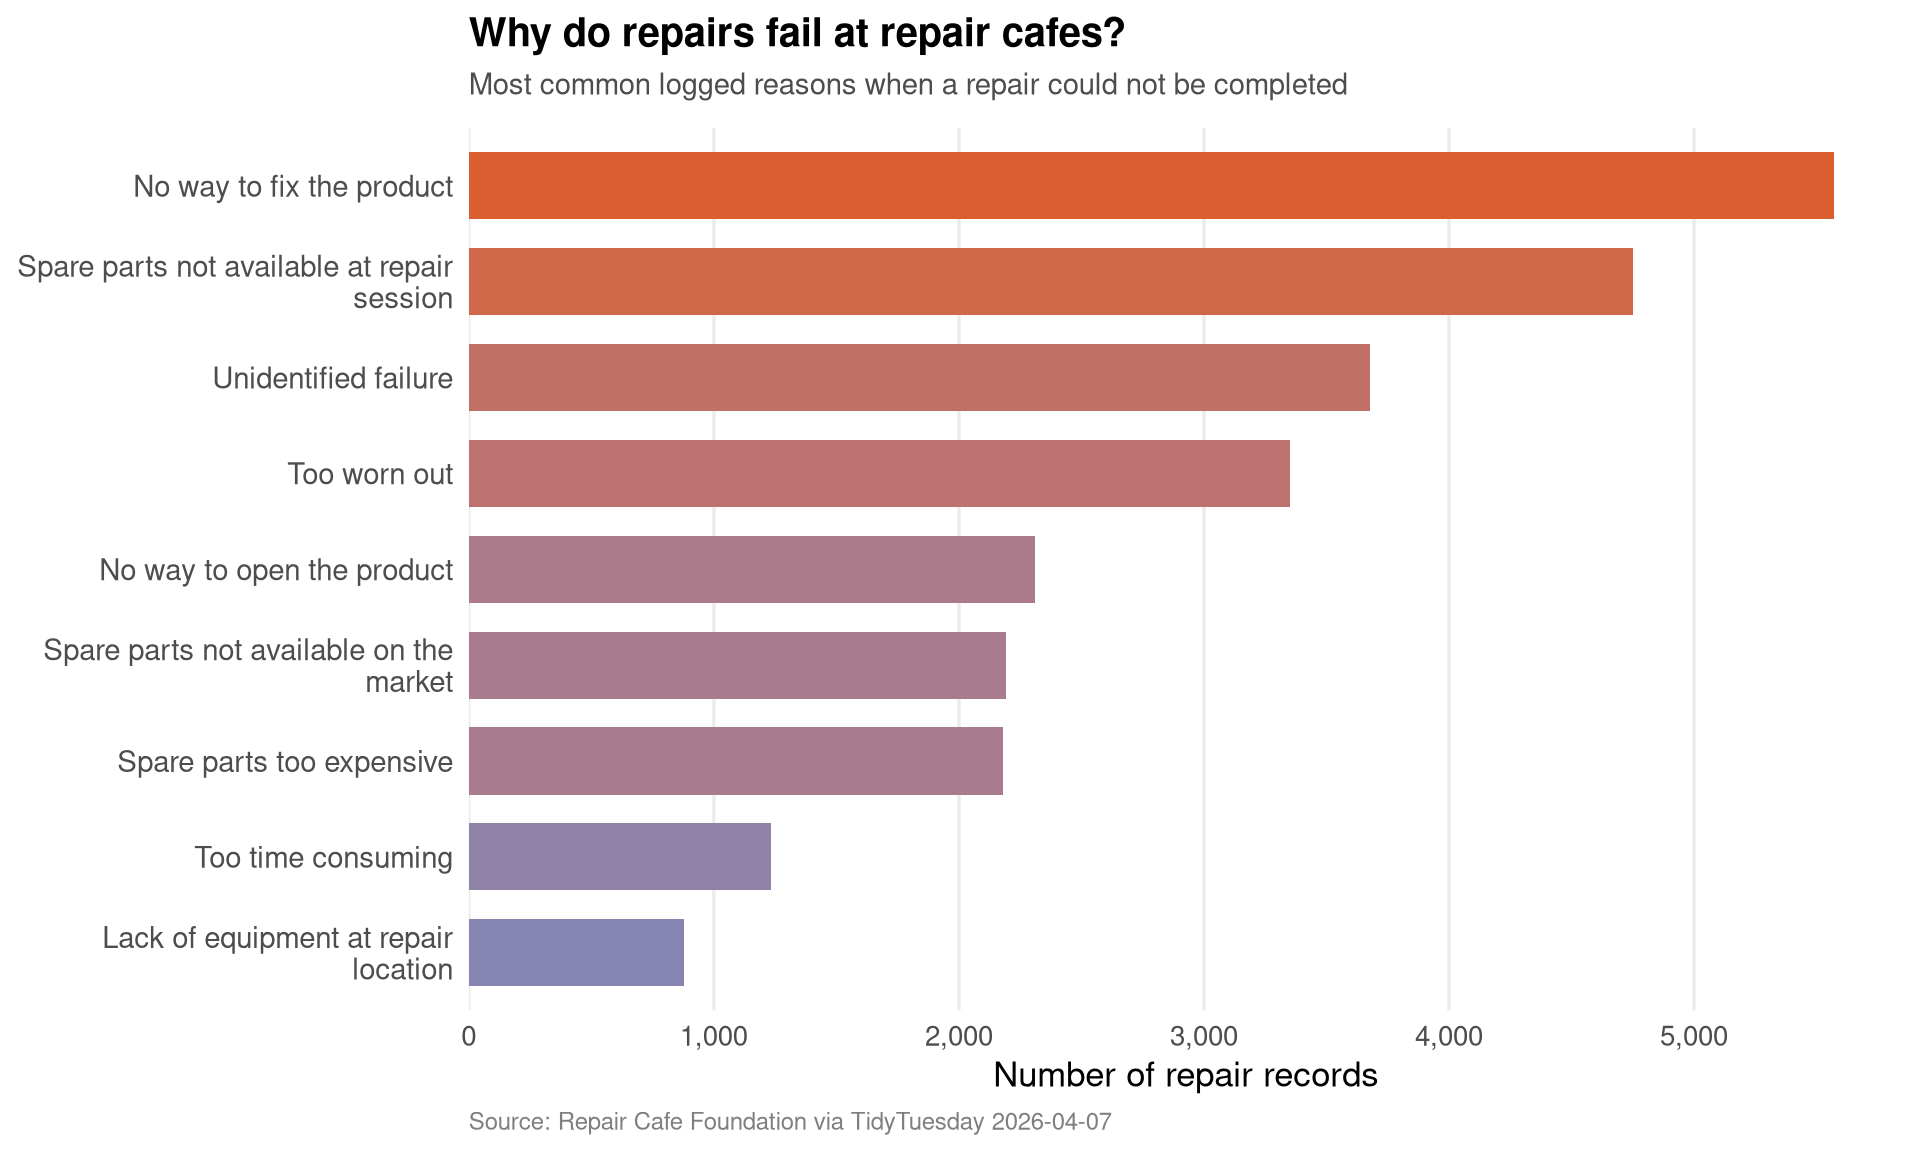
Final thoughts and takeaways
The repair cafe dataset paints an encouraging picture of the repair movement. Across roughly 179,000 logged repair attempts:
Textiles and non-electric tools tend to have the highest full-repair rates. These categories often involve straightforward fixes — sewing a seam, sharpening a blade — that skilled volunteers can reliably complete within a session.
Bicycles and clocks/alarm clocks also perform well. The mechanical nature of these items, combined with the specialized volunteers often present at repair cafes, makes successful repair relatively common.
Electronic and computer equipment sits in the middle. While volunteers can fix many issues, component-level repairs require parts and equipment that aren’t always on hand.
The dominant failure modes are structural rather than skill-related: “No way to fix the product” (e.g., items that are sealed or glued shut) and “Spare parts not available” together account for the largest share of unsuccessful repairs. This points directly at a design and supply chain problem — products engineered without repairability in mind.
The repair cafe model is fundamentally optimistic: bring what’s broken, and skilled community members will try their best. But the data reveals where that optimism runs into systemic barriers. The right-to-repair movement’s emphasis on access to spare parts and service documentation maps directly onto the failure reasons most common in this dataset.