
Tidy Tuesday: Films Based on Video Games
tidytuesday
R
film
video games
reviews
Tracking three decades of video game adaptations from the Uwe Boll trough to the Super Mario Bros. Movie surge.
Preface
From TidyTuesday repository.
The dataset this week comes from the Wikipedia article List of films based on video games. It covers theatrical releases, direct-to-video productions, television films, short films, and documentaries adapted from video games, spanning from the early 1990s to upcoming releases. Each row is a film, with box office figures, critic scores, budgets, and release dates where available.
Suggested angles from the curators:
- Which video game franchise has generated the most film adaptations, and which has earned the most at the box office?
- Which video game publishers have the most film adaptations, and how have they performed at the box office?
- Do audiences and critics agree? Compare CinemaScore grades against Rotten Tomatoes scores.
Thanks to Georgios Karamanis for curating this week’s dataset.
Loading necessary packages
My handy booster pack that allows me to install (if needed) and load my usual and favorite packages, as well as some helpful functions.
Code
# Packages ----------------------------------------------------------------

{
  # Install pak if it's not already installed
  if (!requireNamespace("pak", quietly = TRUE)) {
    install.packages("pak", repos = "https://cloud.r-project.org")
  }

  # CRAN Packages ----
  install_booster_pack <- function(package, load = TRUE) {
    for (pkg in package) {
      if (!requireNamespace(pkg, quietly = TRUE)) {
        pak::pkg_install(pkg)
      }
      if (load) {
        library(pkg, character.only = TRUE)
      }
    }
  }

  core_packages <- c(
    'fs',
    'here',
    'janitor',
    'rio',
    'tidyverse',
    'skimr',
    'paletteer',
    'tidytuesdayR'
  )

  optional_packages <- c('ggrepel', 'ggtext', 'scales')

  install_booster_pack(package = unique(c(core_packages, optional_packages)), load = TRUE)
  rm(install_booster_pack, core_packages, optional_packages)

  # Custom Functions ----

  `%ni%` <- Negate(`%in%`)

  geometric_mean <- function(x) {
    exp(mean(log(x[x > 0]), na.rm = TRUE))
  }

  my_skim <- skim_with(
    numeric = sfl(
      n = length,
      min = ~ min(.x, na.rm = T),
      p25 = ~ stats::quantile(., probs = .25, na.rm = TRUE, names = FALSE),
      med = ~ median(.x, na.rm = T),
      p75 = ~ stats::quantile(., probs = .75, na.rm = TRUE, names = FALSE),
      max = ~ max(.x, na.rm = T),
      mean = ~ mean(.x, na.rm = T),
      geo_mean = ~ geometric_mean(.x),
      sd = ~ stats::sd(., na.rm = TRUE),
      hist = ~ inline_hist(., 5)
    ),
    append = FALSE
  )
}
Load raw data from package
raw <- tidytuesdayR::tt_load('2026-06-09')

game_films <- raw$game_films
Exploratory Data Analysis
The my_skim() function is a modified version of the skimr::skim() function that returns the number of missing data points (cells as NA) as well as the inverse, the count, minimum, 25%, median, 75%, max, mean, geometric mean, and standard deviation. It also generates a little ASCII histogram.
Shape of the catalogue
cat(sprintf("rows: %d cols: %d\n", nrow(game_films), ncol(game_films)))rows: 439 cols: 20game_films %>%
count(category, sort = TRUE)# A tibble: 5 × 2
category n
<chr> <int>
1 Theatrical releases 246
2 Documentaries on video games 67
3 Direct-to-video 54
4 Short films 46
5 Television films 26game_films %>%
filter(category == "Theatrical releases") %>%
count(subcategory, sort = TRUE)# A tibble: 3 × 2
subcategory n
<chr> <int>
1 English 136
2 Japanese 92
3 Mandarin/Cantonese 18Theatrical releases dominate (246 of 439 rows). Documentaries and direct-to-video each take a sizeable slice, but they live in a different world from the wide-release theatrical adaptations that drive cultural attention.
Numeric profile
game_films %>%
  select(release_date, worldwide_box_office, rotten_tomatoes, metacritic, budget_low, budget_high) %>%
my_skim()| Name | Piped data |
| Number of rows | 439 |
| Number of columns | 6 |
| _______________________ | |
| Column type frequency: | |
| Date | 1 |
| numeric | 5 |
| ________________________ | |
| Group variables | None |
Variable type: Date
| skim_variable | n_missing | complete_rate | min | max | median | n_unique |
|---|---|---|---|---|---|---|
| release_date | 89 | 0.8 | 1986-07-20 | 2028-12-22 | 2013-11-09 | 296 |
Variable type: numeric
| skim_variable | n_missing | complete_rate | n | min | p25 | med | p75 | max | mean | geo_mean | sd | hist |
|---|---|---|---|---|---|---|---|---|---|---|---|---|
| worldwide_box_office | 343 | 0.22 | 439 | 61511 | 18270676.0 | 84366422 | 340357739.2 | 5.02e+09 | 674816191.00 | 73086527.87 | 1.346590e+09 | ▇▁▁▁▁ |
| rotten_tomatoes | 366 | 0.17 | 439 | 0 | 16.0 | 30 | 51.0 | 1.00e+02 | 35.18 | 25.88 | 2.452000e+01 | ▇▅▅▃▁ |
| metacritic | 376 | 0.14 | 439 | 9 | 28.5 | 36 | 46.5 | 8.80e+01 | 37.37 | 34.52 | 1.403000e+01 | ▃▇▆▁▁ |
| budget_low | 372 | 0.15 | 439 | 1800000 | 23500000.0 | 45000000 | 92500000.0 | 3.00e+08 | 63632835.82 | 39286793.05 | 6.023746e+07 | ▇▃▁▁▁ |
| budget_high | 372 | 0.15 | 439 | 1800000 | 23500000.0 | 45000000 | 97500000.0 | 3.00e+08 | 65901492.54 | 41079088.11 | 6.215781e+07 | ▇▃▂▁▁ |
Three honest realities:
- Sparse scores. Most films have neither a Rotten Tomatoes score nor a CinemaScore. The graded universe is small enough that you can almost name every film in it.
- Currency mix. Box office reports come in
$(82 films) and¥(14 films). I’ll keep the analysis to USD so the y-axis is interpretable. - Heavy right tail. Box office is hugely skewed — the median USD gross is ~$84M but the max is $5B (when both Mario films are added together). One blockbuster can drag every aggregate.
The video game movie curse — and the moment it broke
The cultural story of video game movies has a familiar shape: a wave of cheap, critically panned adaptations through the 1990s and 2000s (the Uwe Boll era), then a slow re-engineering through the 2010s, and finally a commercial breakout starting with Sonic the Hedgehog (2020) and culminating in The Super Mario Bros. Movie in 2023.
Let me check whether the data actually supports that arc.
Era table
theatrical <- game_films %>%
  filter(category == "Theatrical releases") %>%
  mutate(
    year = lubridate::year(release_date),
    era = case_when(
      year < 2000 ~ "1990s",
      year < 2010 ~ "2000s",
      year < 2020 ~ "2010s",
      year >= 2020 ~ "2020s",
      TRUE        ~ NA_character_
    ),
    era = factor(era, levels = c("1990s", "2000s", "2010s", "2020s"))
  )

stopifnot(
  "theatrical has 0 rows" = nrow(theatrical) > 0,
  "era never matched" = sum(!is.na(theatrical$era)) > 0
)

era_summary <- theatrical %>%
  filter(!is.na(era)) %>%
  group_by(era) %>%
  summarise(
    n_films       = n(),
    n_with_rt     = sum(!is.na(rotten_tomatoes)),
    median_rt     = median(rotten_tomatoes, na.rm = TRUE),
    mean_rt       = round(mean(rotten_tomatoes, na.rm = TRUE), 1),
    median_bo_usd = median(worldwide_box_office[worldwide_box_office_currency == "$"], na.rm = TRUE),
    .groups       = "drop"
  )

era_summary
# A tibble: 4 × 6
era n_films n_with_rt median_rt mean_rt median_bo_usd
<fct> <int> <int> <dbl> <dbl> <dbl>
1 1990s 17 9 17 25.4 51376861
2 2000s 43 23 18 20.7 28023563
3 2010s 88 22 37.5 41.7 75706238
4 2020s 38 19 51 49.7 50102224The pattern is real. The median critic score climbs from 17% (1990s) to 51% (2020s), and median worldwide gross — for the USD-denominated subset — roughly triples between the 2000s and the 2020s. The 2000s were genuinely the trough of both quality and commercial pull.
Publisher league table
publishers_usd <- game_films %>%
  filter(
    worldwide_box_office_currency == "$",
    !is.na(original_game_publisher),
    !is.na(worldwide_box_office)
  ) %>%
  group_by(original_game_publisher) %>%
  summarise(
    n_films  = n(),
    total_bo = sum(worldwide_box_office),
    median_rt = median(rotten_tomatoes, na.rm = TRUE),
    .groups  = "drop"
  ) %>%
  arrange(desc(total_bo))

stopifnot("publishers_usd empty" = nrow(publishers_usd) > 0)

publishers_usd %>%
  slice_head(n = 10)
# A tibble: 10 × 4
original_game_publisher n_films total_bo median_rt
<chr> <int> <dbl> <dbl>
1 Nintendo 3 2231390409 43
2 Capcom 15 1448524033 36
3 Sega 5 1240895284 66.5
4 Nintendo | The Pokémon Company 10 1013338759 20
5 Mojang Studios 1 957802316 47
6 Ubisoft 4 578605421 37
7 ScottGames 2 533512069 24.5
8 Eidos 3 532485046 20
9 Warner Bros. Games 2 511629246 53
10 Rovio Entertainment 2 500125976 57.5Nintendo’s three theatrical releases — the original 1993 Super Mario Bros., the 2023 Super Mario Bros. Movie, and the upcoming Super Mario Galaxy Movie — together gross more than Capcom’s fifteen films combined. The Pokémon Company joint adds another billion. The catalogue is profoundly top-heavy.
Visualizing the curse breaking
The plot below puts every USD-denominated theatrical release on a release-date × Rotten-Tomatoes plane. Point area is worldwide box office, colour is era, and a loess trend tracks the long arc of critical reception.
plot_df <- theatrical %>%
  filter(
    worldwide_box_office_currency == "$",
    !is.na(release_date),
    !is.na(rotten_tomatoes),
    !is.na(worldwide_box_office),
    !is.na(era)
  )

cat(sprintf("plot_df: %d rows\n", nrow(plot_df)))
plot_df: 71 rowsstopifnot("plot_df has 0 rows — check filter values" = nrow(plot_df) > 0)
label_titles <- c(
"Super Mario Bros.",
"Mortal Kombat",
"Lara Croft: Tomb Raider",
"Warcraft",
"Pokémon Detective Pikachu",
"Sonic the Hedgehog",
"The Super Mario Bros. Movie",
"Sonic the Hedgehog 3",
"A Minecraft Movie"
)
label_df <- plot_df %>%
filter(title %in% label_titles)
cat(sprintf("label_df: %d / %d hits\n", nrow(label_df), length(label_titles)))label_df: 10 / 9 hitsera_colors <- paletteer::paletteer_d("NineteenEightyR::cobra", n = 5)[c(1, 2, 3, 5)]
names(era_colors) <- c("1990s", "2000s", "2010s", "2020s")
p <- ggplot(plot_df, aes(x = release_date, y = rotten_tomatoes)) +
geom_hline(yintercept = 60, linetype = "dashed", color = "grey50", linewidth = 0.4) +
annotate(
"text",
x = as.Date("1993-06-01"),
y = 62.5,
label = "Fresh threshold (60%)",
hjust = 0, vjust = 0,
size = 3.1, color = "grey35", fontface = "italic"
) +
geom_smooth(
method = "loess",
se = TRUE,
color = "grey20",
fill = "grey80",
alpha = 0.35,
linewidth = 0.7
) +
geom_point(
aes(size = worldwide_box_office, fill = era),
shape = 21, color = "white", stroke = 0.4, alpha = 0.9
) +
ggrepel::geom_text_repel(
data = label_df,
aes(label = title),
size = 3.1,
family = "sans",
color = "grey15",
box.padding = 0.55,
point.padding = 0.35,
min.segment.length = 0,
segment.color = "grey50",
segment.size = 0.3,
max.overlaps = Inf,
seed = 42
) +
scale_fill_manual(values = era_colors, name = "Release era") +
scale_size_area(
name = "Worldwide gross",
max_size = 16,
breaks = c(5e7, 2e8, 5e8, 1e9),
labels = scales::label_dollar(scale = 1e-6, suffix = "M", accuracy = 1)
) +
scale_x_date(date_breaks = "5 years", date_labels = "%Y") +
scale_y_continuous(limits = c(0, 100), breaks = seq(0, 100, 20), labels = function(x) paste0(x, "%")) +
guides(
fill = guide_legend(override.aes = list(size = 5)),
size = guide_legend(override.aes = list(fill = "grey60"))
) +
labs(
title = "The video game movie curse is finally breaking",
subtitle = "Theatrical adaptations by release date, Rotten Tomatoes score, and worldwide box office (USD)",
x = NULL,
y = "Rotten Tomatoes critic score",
caption = "Source: Wikipedia via TidyTuesday 2026-06-09 · Theatrical releases priced in USD only"
) +
theme_minimal(base_size = 12) +
theme(
plot.title = element_text(face = "bold", size = 16, margin = margin(b = 4)),
plot.subtitle = element_text(color = "grey30", margin = margin(b = 14)),
plot.caption = element_text(color = "grey45", size = 8.5, hjust = 0, margin = margin(t = 12)),
panel.grid.minor = element_blank(),
panel.grid.major = element_line(color = "grey92"),
legend.position = "bottom",
legend.box = "horizontal",
legend.title = element_text(face = "bold", size = 9),
legend.text = element_text(size = 9),
plot.background = element_rect(fill = "white", color = NA),
panel.background = element_rect(fill = "white", color = NA)
)
p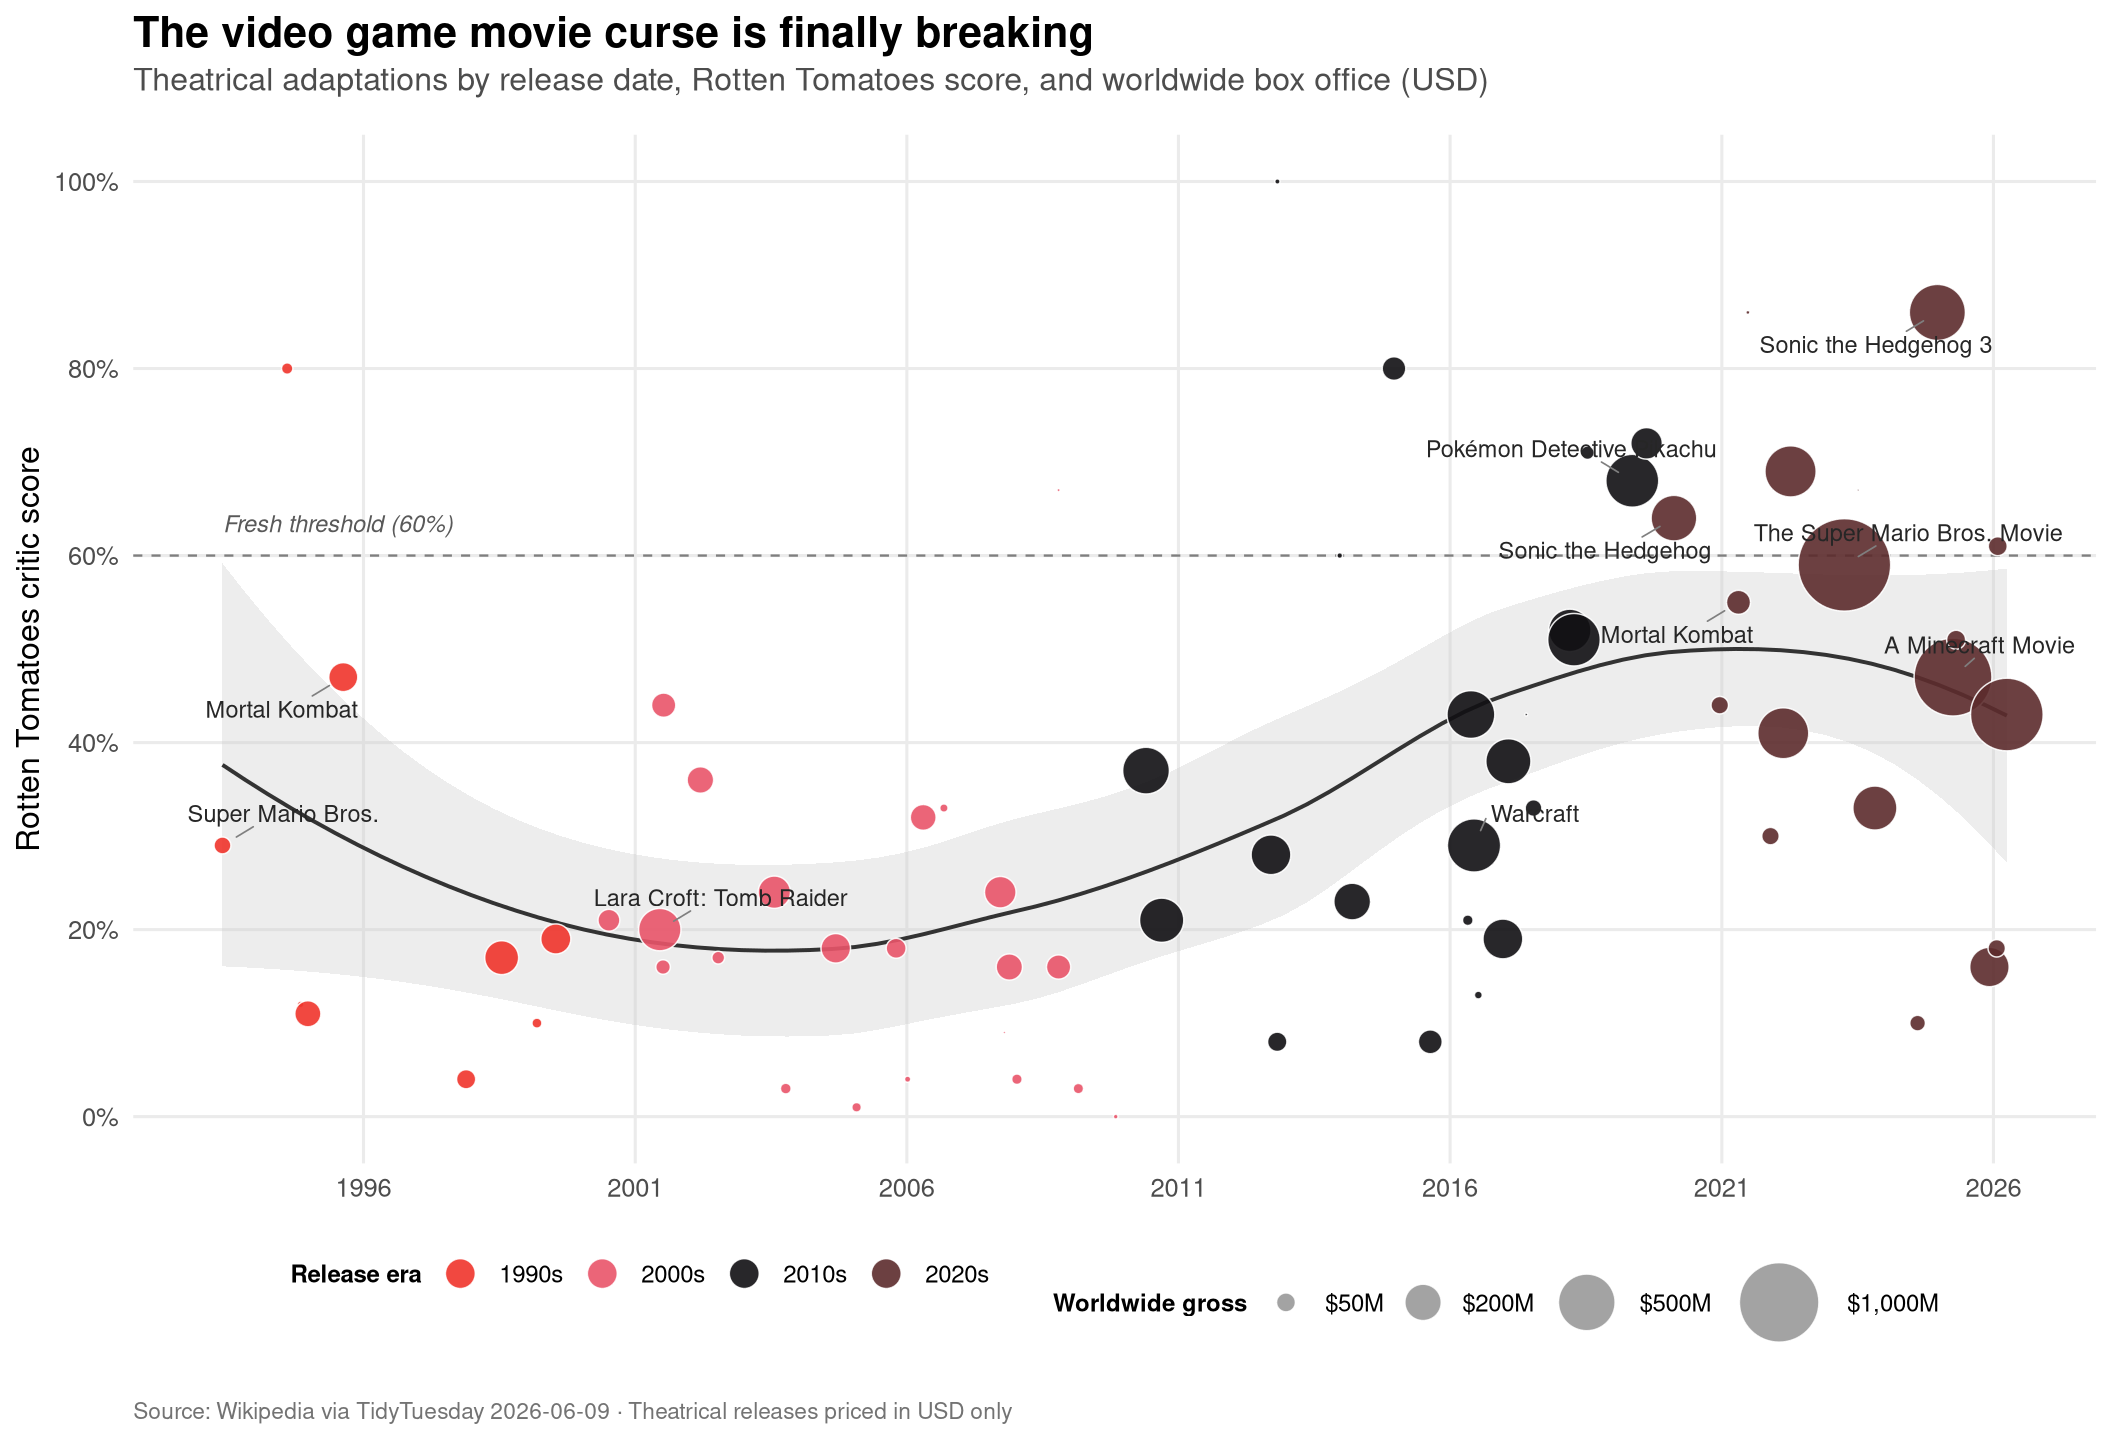
The loess line spends nearly two decades parked in the low 20s — the genre genuinely earned its reputation as critic-proof shovelware. Around 2018 it lifts off, and Sonic the Hedgehog 3 (86%) is the first adaptation in the dataset to clear 80% Fresh while also clearing $400M worldwide. The Super Mario Bros. Movie did not need critical love to make $1.36B; it broke the commercial half of the curse all on its own.
A second look: era distributions
violin_df <- theatrical %>%
  filter(!is.na(rotten_tomatoes), !is.na(era))

stopifnot("violin_df has 0 rows" = nrow(violin_df) > 0)

p2 <- ggplot(violin_df, aes(x = era, y = rotten_tomatoes, fill = era)) +
  geom_violin(alpha = 0.55, color = NA, trim = FALSE) +
  geom_boxplot(width = 0.18, outlier.shape = NA, color = "grey15", fill = "white", alpha = 0.9) +
  geom_jitter(width = 0.08, alpha = 0.55, size = 1.4, color = "grey20") +
  geom_hline(yintercept = 60, linetype = "dashed", color = "grey50", linewidth = 0.4) +
  scale_fill_manual(values = era_colors, guide = "none") +
  scale_y_continuous(limits = c(0, 100), breaks = seq(0, 100, 20), labels = function(x) paste0(x, "%")) +
  labs(
    title    = "Critics warmed up one decade at a time",
    subtitle = "Distribution of Rotten Tomatoes scores for theatrical video game adaptations",
    x = NULL,
    y = "Rotten Tomatoes critic score",
    caption = "Source: Wikipedia via TidyTuesday 2026-06-09"
  ) +
  theme_minimal(base_size = 12) +
  theme(
    plot.title       = element_text(face = "bold", size = 15, margin = margin(b = 4)),
    plot.subtitle    = element_text(color = "grey30", margin = margin(b = 14)),
    plot.caption     = element_text(color = "grey45", size = 8.5, hjust = 0, margin = margin(t = 12)),
    panel.grid.minor = element_blank(),
    panel.grid.major.x = element_blank(),
    panel.grid.major.y = element_line(color = "grey92"),
    plot.background  = element_rect(fill = "white", color = NA),
    panel.background = element_rect(fill = "white", color = NA)
  )

p2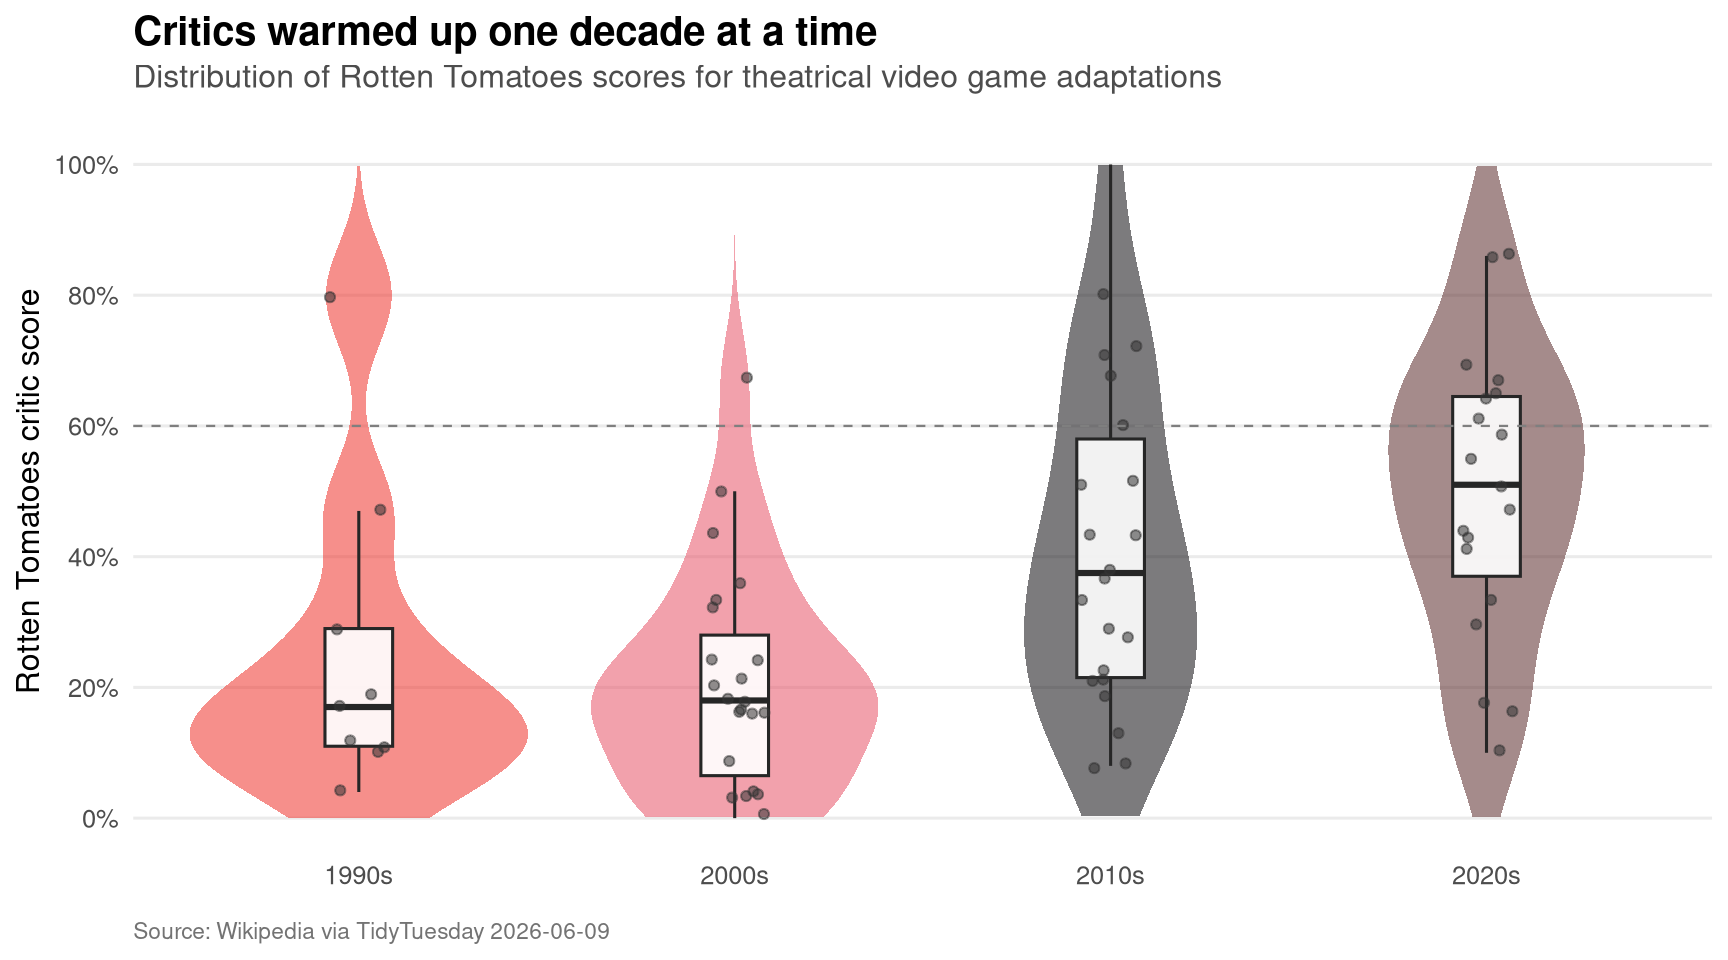
The 2000s violin is the worst of the bunch — a fat cluster of films below 30% with no upper tail to speak of. The 2020s violin is wider and taller: the failures still happen (Borderlands and Five Nights at Freddy’s both undershot), but the ceiling has lifted enough that a Sonic 3 or Detective Pikachu outcome is now plausible rather than freakish.
Final thoughts and takeaways
Three readings of the data feel defensible:
- The curse is real, but it was a quality curse before it was a commercial one. Box office crept up through the 2010s while critics still hated almost everything. The critical turn — median RT going from 18% in the 2000s to 51% in the 2020s — is the bigger structural change.
- Nintendo plays a different game. Three theatrical films, $2.2B in worldwide gross, with the Super Mario Bros. Movie alone clearing a billion. Nothing else in the catalogue scales like that, and it skews every per-publisher aggregate.
- Sample sizes are tiny. Only ~70 theatrical releases have both a USD box office figure and a Rotten Tomatoes score. The era trend is suggestive, not a clinical demonstration, and any one studio’s slate (Sony’s PlayStation Productions, Legendary’s Detective Pikachu / Pokémon line, Paramount’s Sonic franchise) can move the medians more than a genuine industry-wide shift would.
The next decade should tell us whether Sonic 3 and the upcoming Super Mario Galaxy Movie (already $832M with a 43% RT) are the new normal, or whether 2023–2026 was the surge before the cycle resets.