Tidy Tuesday: Papal Encyclicals and Technological Revolutions
tidytuesday
R
text-analysis
religion
history
Comparing two papal encyclicals written 135 years apart — one confronting the Industrial Revolution, the other confronting artificial intelligence — through paragraph structure, scripture references, and the longer history of papal communication.
Preface
From TidyTuesday repository.
This week we’re exploring papal encyclicals — the most authoritative form of papal teaching in the Catholic Church. The primary dataset contains the full paragraph-level text of two encyclicals that bookend 135 years of technological revolution: Pope Leo XIII’s Rerum Novarum (1891), which addressed the Industrial Revolution’s impact on workers, and Pope Leo XIV’s Magnifica Humanitas (2026), which addresses artificial intelligence’s impact on human dignity.
The obvious trap with this dataset is to turn two documents into a grand theory of history. That would be too much weight for the data. Instead, I am treating this as a comparative reading exercise with just enough quantification to make the contrast visible: how long the arguments are, how scripture is distributed, and how these two documents sit inside the longer historical record of papal encyclicals.
Loading necessary packages
My handy booster pack that allows me to install (if needed) and load my usual and favorite packages, as well as some helpful functions.
Code
# Packages ----------------------------------------------------------------
{
  if (!requireNamespace("pak", quietly = TRUE)) {
    install.packages("pak", repos = "https://cloud.r-project.org")
  }

  install_booster_pack <- function(package, load = TRUE) {
    for (pkg in package) {
      if (!requireNamespace(pkg, quietly = TRUE)) {
        pak::pkg_install(pkg)
      }
      if (load) {
        library(pkg, character.only = TRUE)
      }
    }
  }

  core_packages <- c(
    "fs",
    "here",
    "janitor",
    "tidyverse",
    "skimr",
    "paletteer",
    "tidytuesdayR",
    "scales"
  )

  install_booster_pack(package = unique(core_packages), load = TRUE)
  rm(install_booster_pack, core_packages)

  `%ni%` <- Negate(`%in%`)

  geometric_mean <- function(x) {
    exp(mean(log(x[x > 0]), na.rm = TRUE))
  }

  my_skim <- skim_with(
    numeric = sfl(
      n = length,
      min = ~ min(.x, na.rm = TRUE),
      p25 = ~ stats::quantile(., probs = .25, na.rm = TRUE, names = FALSE),
      med = ~ median(.x, na.rm = TRUE),
      p75 = ~ stats::quantile(., probs = .75, na.rm = TRUE, names = FALSE),
      max = ~ max(.x, na.rm = TRUE),
      mean = ~ mean(.x, na.rm = TRUE),
      geo_mean = ~ geometric_mean(.x),
      sd = ~ stats::sd(., na.rm = TRUE),
      hist = ~ inline_hist(., 5)
    ),
    append = FALSE
  )
}
Load raw data from package
raw <- tidytuesdayR::tt_load("2026-06-23")

encyclicals <- raw$encyclicals %>%
  janitor::clean_names()

papal_encyclicals <- raw$papal_encyclicals %>%
  janitor::clean_names()

scripture_references <- raw$scripture_references %>%
  janitor::clean_names()
Exploratory Data Analysis
The primary data has three useful layers: paragraph-level text from two encyclicals, scripture citations extracted from those texts, and a historical metadata table for 213 encyclicals from 1878 through 2026.
inventory <- tibble(
  table = c("encyclicals", "papal_encyclicals", "scripture_references"),
  rows = c(nrow(encyclicals), nrow(papal_encyclicals), nrow(scripture_references)),
  columns = c(ncol(encyclicals), ncol(papal_encyclicals), ncol(scripture_references))
)

inventory
# A tibble: 3 × 3
table rows columns
<chr> <int> <int>
1 encyclicals 309 7
2 papal_encyclicals 213 9
3 scripture_references 50 7The comparison is intentionally narrow: Rerum Novarum and Magnifica Humanitas are not random samples of papal writing. They are two curated documents selected because they rhyme historically: industrial labor in 1891 and artificial intelligence in 2026.
text_summary <- encyclicals %>%
  group_by(encyclical, pope, year) %>%
  summarise(
    paragraphs = n(),
    total_words = sum(word_count, na.rm = TRUE),
    median_words_per_paragraph = median(word_count, na.rm = TRUE),
    total_sentences = sum(sentence_count, na.rm = TRUE),
    .groups = "drop"
  ) %>%
  arrange(year)

text_summary
# A tibble: 2 × 7
encyclical pope year paragraphs total_words median_words_per_par…¹
<chr> <chr> <dbl> <int> <dbl> <dbl>
1 Rerum Novarum Leo X… 1891 64 13961 188
2 Magnifica Humanitas Leo X… 2026 245 37261 148
# ℹ abbreviated name: ¹median_words_per_paragraph
# ℹ 1 more variable: total_sentences <dbl>One immediate structural difference: the AI-era text is much longer in total, but Rerum Novarum has the larger median paragraph. That is a useful distinction. Length here is not just volume; it is also pacing.
Two Leos, two technological crises
plot_colors <- as.character(paletteer::paletteer_d("MetBrewer::Archambault", n = 7))
leo_colors <- c("Rerum Novarum" = plot_colors[2], "Magnifica Humanitas" = plot_colors[5])

paragraph_plot_data <- encyclicals %>%
  mutate(
    encyclical = factor(encyclical, levels = c("Rerum Novarum", "Magnifica Humanitas")),
    paragraph_band = case_when(
      word_count < 100 ~ "<100 words",
      word_count < 200 ~ "100–199 words",
      TRUE ~ "200+ words"
    ),
    paragraph_band = factor(paragraph_band, levels = c("<100 words", "100–199 words", "200+ words"))
  )

stopifnot("paragraph_plot_data has rows" = nrow(paragraph_plot_data) > 0)

p <- ggplot(paragraph_plot_data, aes(x = encyclical, y = word_count, fill = encyclical)) +
  geom_violin(alpha = 0.35, color = NA, trim = FALSE) +
  geom_boxplot(width = 0.18, outlier.shape = NA, alpha = 0.85, color = "grey20") +
  geom_jitter(aes(color = encyclical), width = 0.08, alpha = 0.38, size = 1.4, show.legend = FALSE) +
  scale_fill_manual(values = leo_colors, guide = "none") +
  scale_color_manual(values = leo_colors, guide = "none") +
  scale_y_continuous(labels = scales::comma) +
  labs(
    title = "The AI-era encyclical is longer; the industrial-era paragraphs are denser",
    subtitle = "Paragraph-level word counts from Rerum Novarum (1891) and Magnifica Humanitas (2026)",
    x = NULL,
    y = "Words per paragraph",
    caption = "Source: TidyTuesday 2026-06-23, Vatican.va"
  ) +
  theme_minimal(base_size = 13) +
  theme(
    plot.title = element_text(face = "bold"),
    panel.grid.minor = element_blank(),
    axis.text.x = element_text(face = "bold")
  )

p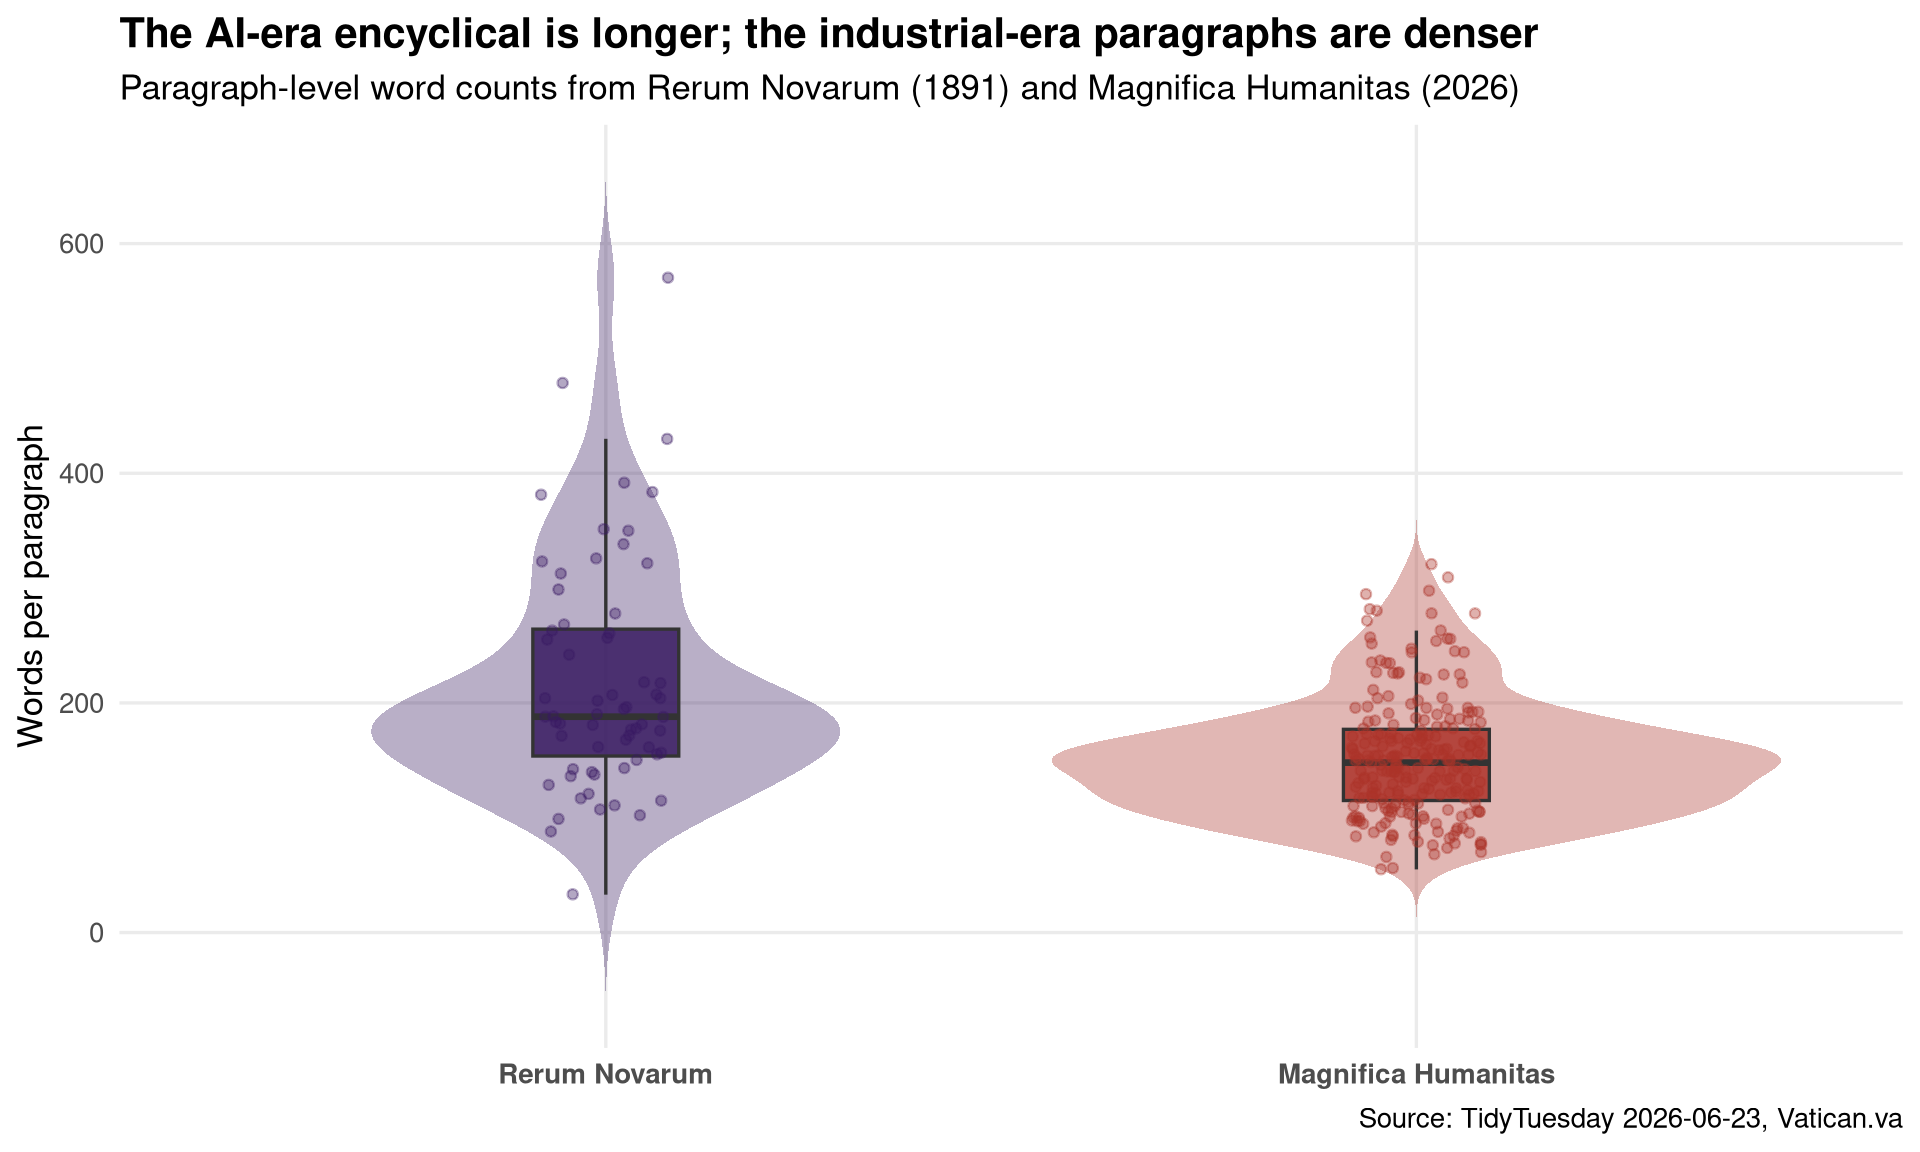
The paragraph distribution puts a check on the easy narrative. Magnifica Humanitas is the larger document by total word count, but it is not simply “more verbose paragraph by paragraph.” It moves through more paragraphs. Rerum Novarum spends more words in a typical paragraph, which gives it a denser argumentative cadence.
Scripture as an argumentative scaffold
scripture_summary <- scripture_references %>%
  count(encyclical, pope, testament, name = "references") %>%
  group_by(encyclical) %>%
  mutate(share = references / sum(references)) %>%
  ungroup() %>%
  arrange(encyclical, desc(references))

scripture_summary
# A tibble: 4 × 5
encyclical pope testament references share
<chr> <chr> <chr> <int> <dbl>
1 Magnifica Humanitas Leo XIV New Testament 13 0.591
2 Magnifica Humanitas Leo XIV Old Testament 9 0.409
3 Rerum Novarum Leo XIII New Testament 19 0.679
4 Rerum Novarum Leo XIII Old Testament 9 0.321Both documents draw more from the New Testament than the Old Testament. The contrast is not “one biblical, one not.” It is subtler: the 2026 text distributes its citations across the Tower of Babel, Nehemiah, Matthew, John, Acts, and Pauline material, while Rerum Novarum leans heavily into Genesis and Matthew.
book_plot_data <- scripture_references %>%
  count(encyclical, testament, book, name = "references") %>%
  group_by(encyclical) %>%
  slice_max(references, n = 7, with_ties = FALSE) %>%
  ungroup() %>%
  mutate(
    book = forcats::fct_reorder(book, references),
    encyclical = factor(encyclical, levels = c("Rerum Novarum", "Magnifica Humanitas"))
  )

stopifnot("book_plot_data has rows" = nrow(book_plot_data) > 0)

p <- ggplot(book_plot_data, aes(x = references, y = book, fill = testament)) +
  geom_col(width = 0.72) +
  facet_wrap(~ encyclical, scales = "free_y") +
  scale_fill_manual(values = c("Old Testament" = plot_colors[3], "New Testament" = plot_colors[6])) +
  scale_x_continuous(breaks = scales::breaks_pretty()) +
  labs(
    title = "Matthew and Genesis anchor both documents, but the citation mix spreads differently",
    subtitle = "Top cited biblical books within each encyclical",
    x = "Citation count",
    y = NULL,
    fill = NULL,
    caption = "Source: TidyTuesday 2026-06-23, scripture_references.csv"
  ) +
  theme_minimal(base_size = 13) +
  theme(
    plot.title = element_text(face = "bold"),
    panel.grid.minor = element_blank(),
    legend.position = "top",
    strip.text = element_text(face = "bold")
  )

p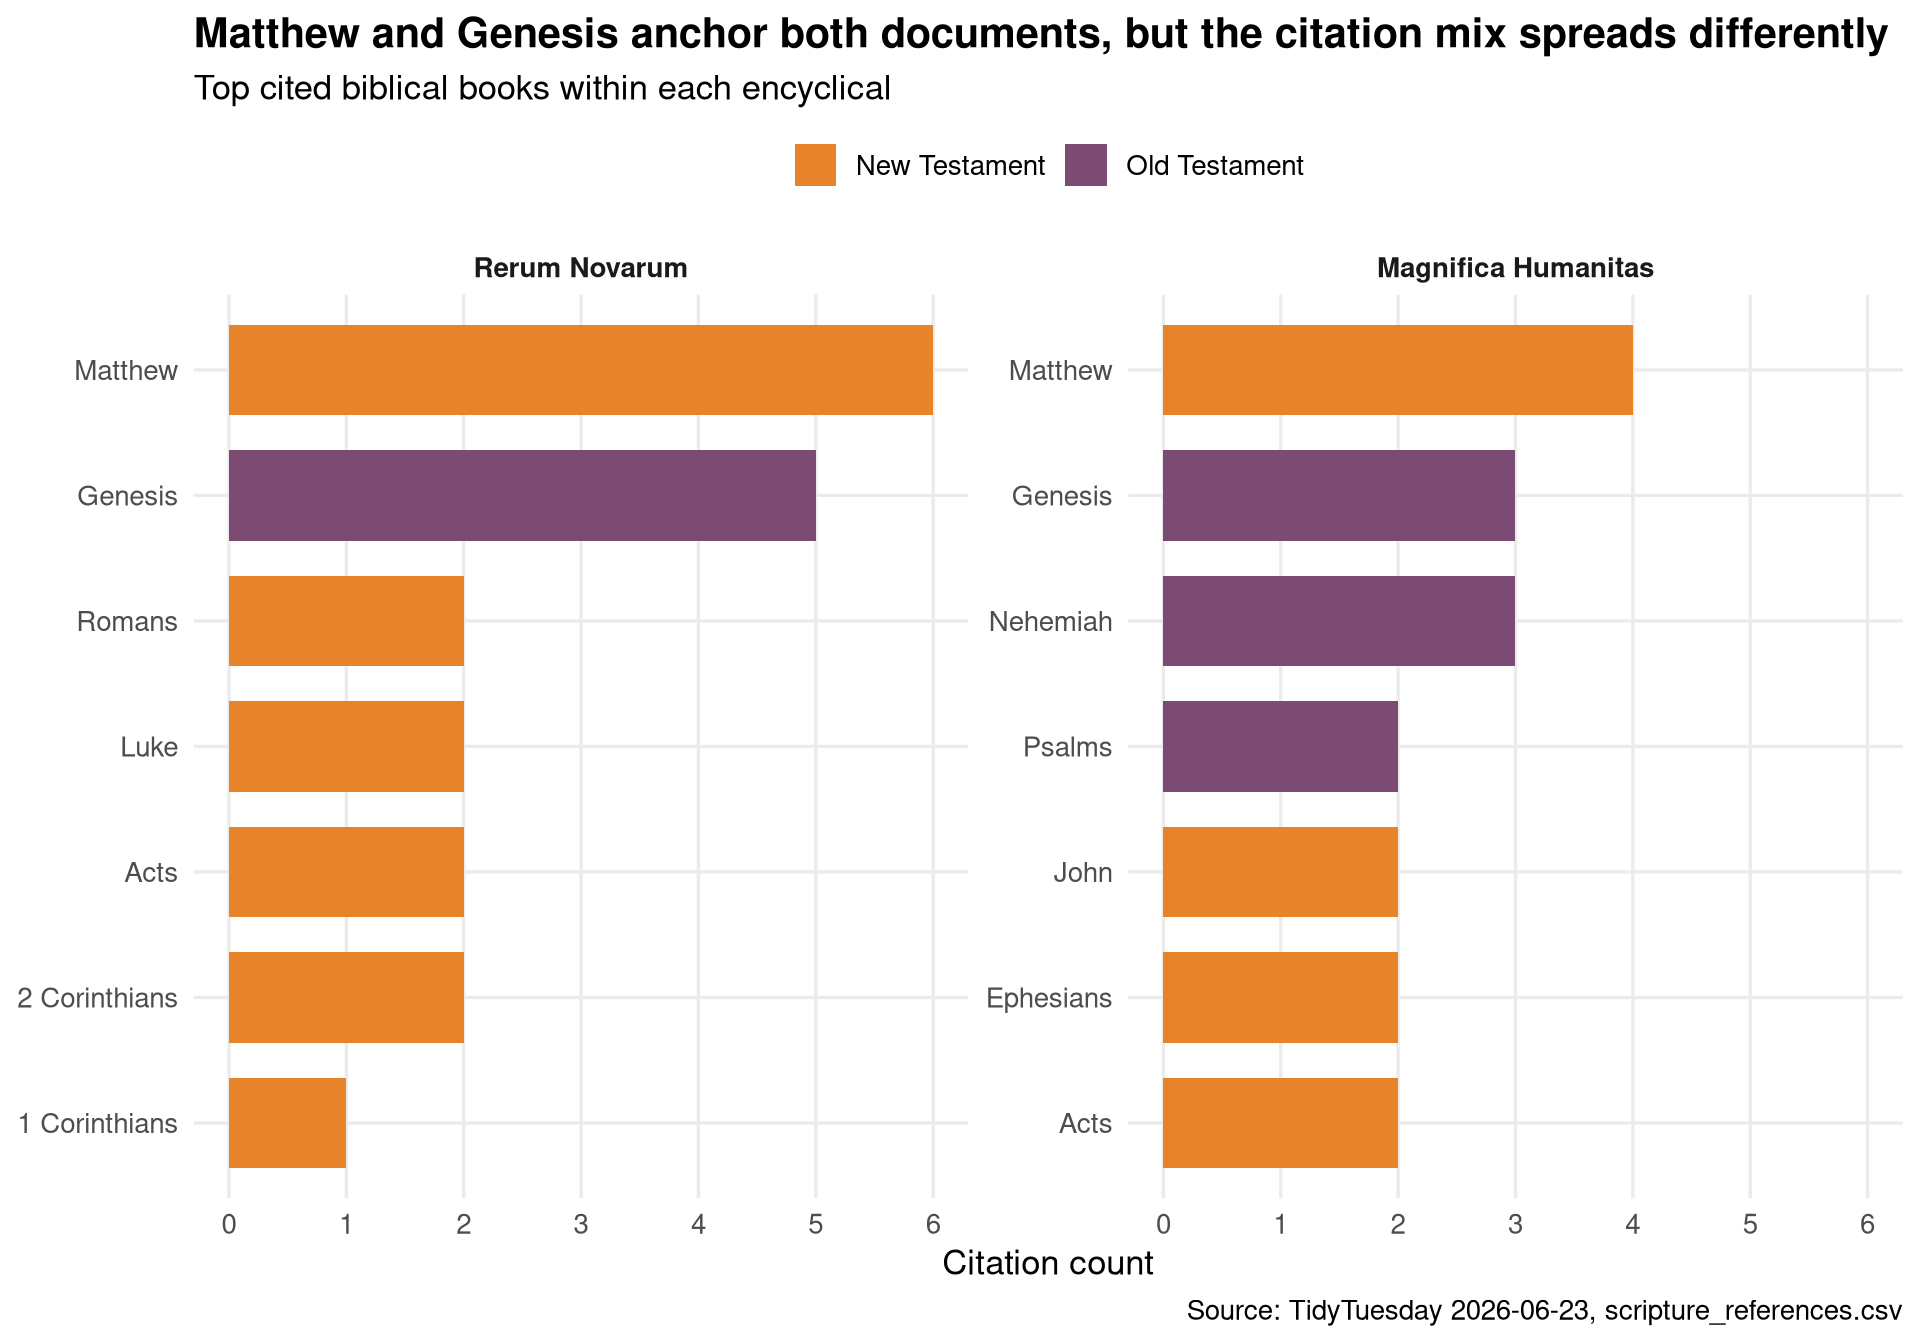
That is the more interesting reading: the shared books mark continuity, but the spread of references suggests different problems being worked through. In this dataset, the industrial labor question and the artificial intelligence question both get mapped onto older theological grammar. The point is not that the grammar stayed unchanged. The point is that the new problem is being translated into a recognizable institutional language.
The longer history is uneven
top_popes <- papal_encyclicals %>%
  count(pope, birth_country, name = "encyclicals") %>%
  slice_max(encyclicals, n = 10, with_ties = FALSE) %>%
  mutate(pope = forcats::fct_reorder(pope, encyclicals))

stopifnot("top_popes has rows" = nrow(top_popes) > 0)

p <- ggplot(top_popes, aes(x = encyclicals, y = pope, fill = birth_country)) +
  geom_col(width = 0.72) +
  scale_fill_manual(values = rep_len(plot_colors, length(unique(top_popes$birth_country)))) +
  labs(
    title = "The historical encyclical record is dominated by a few prolific popes",
    subtitle = "Top ten popes by number of encyclicals in the 1878–2026 metadata table",
    x = "Number of encyclicals",
    y = NULL,
    fill = "Birth country",
    caption = "Source: TidyTuesday 2026-06-23, papal_encyclicals.csv"
  ) +
  theme_minimal(base_size = 13) +
  theme(
    plot.title = element_text(face = "bold"),
    panel.grid.minor = element_blank(),
    legend.position = "top"
  )

p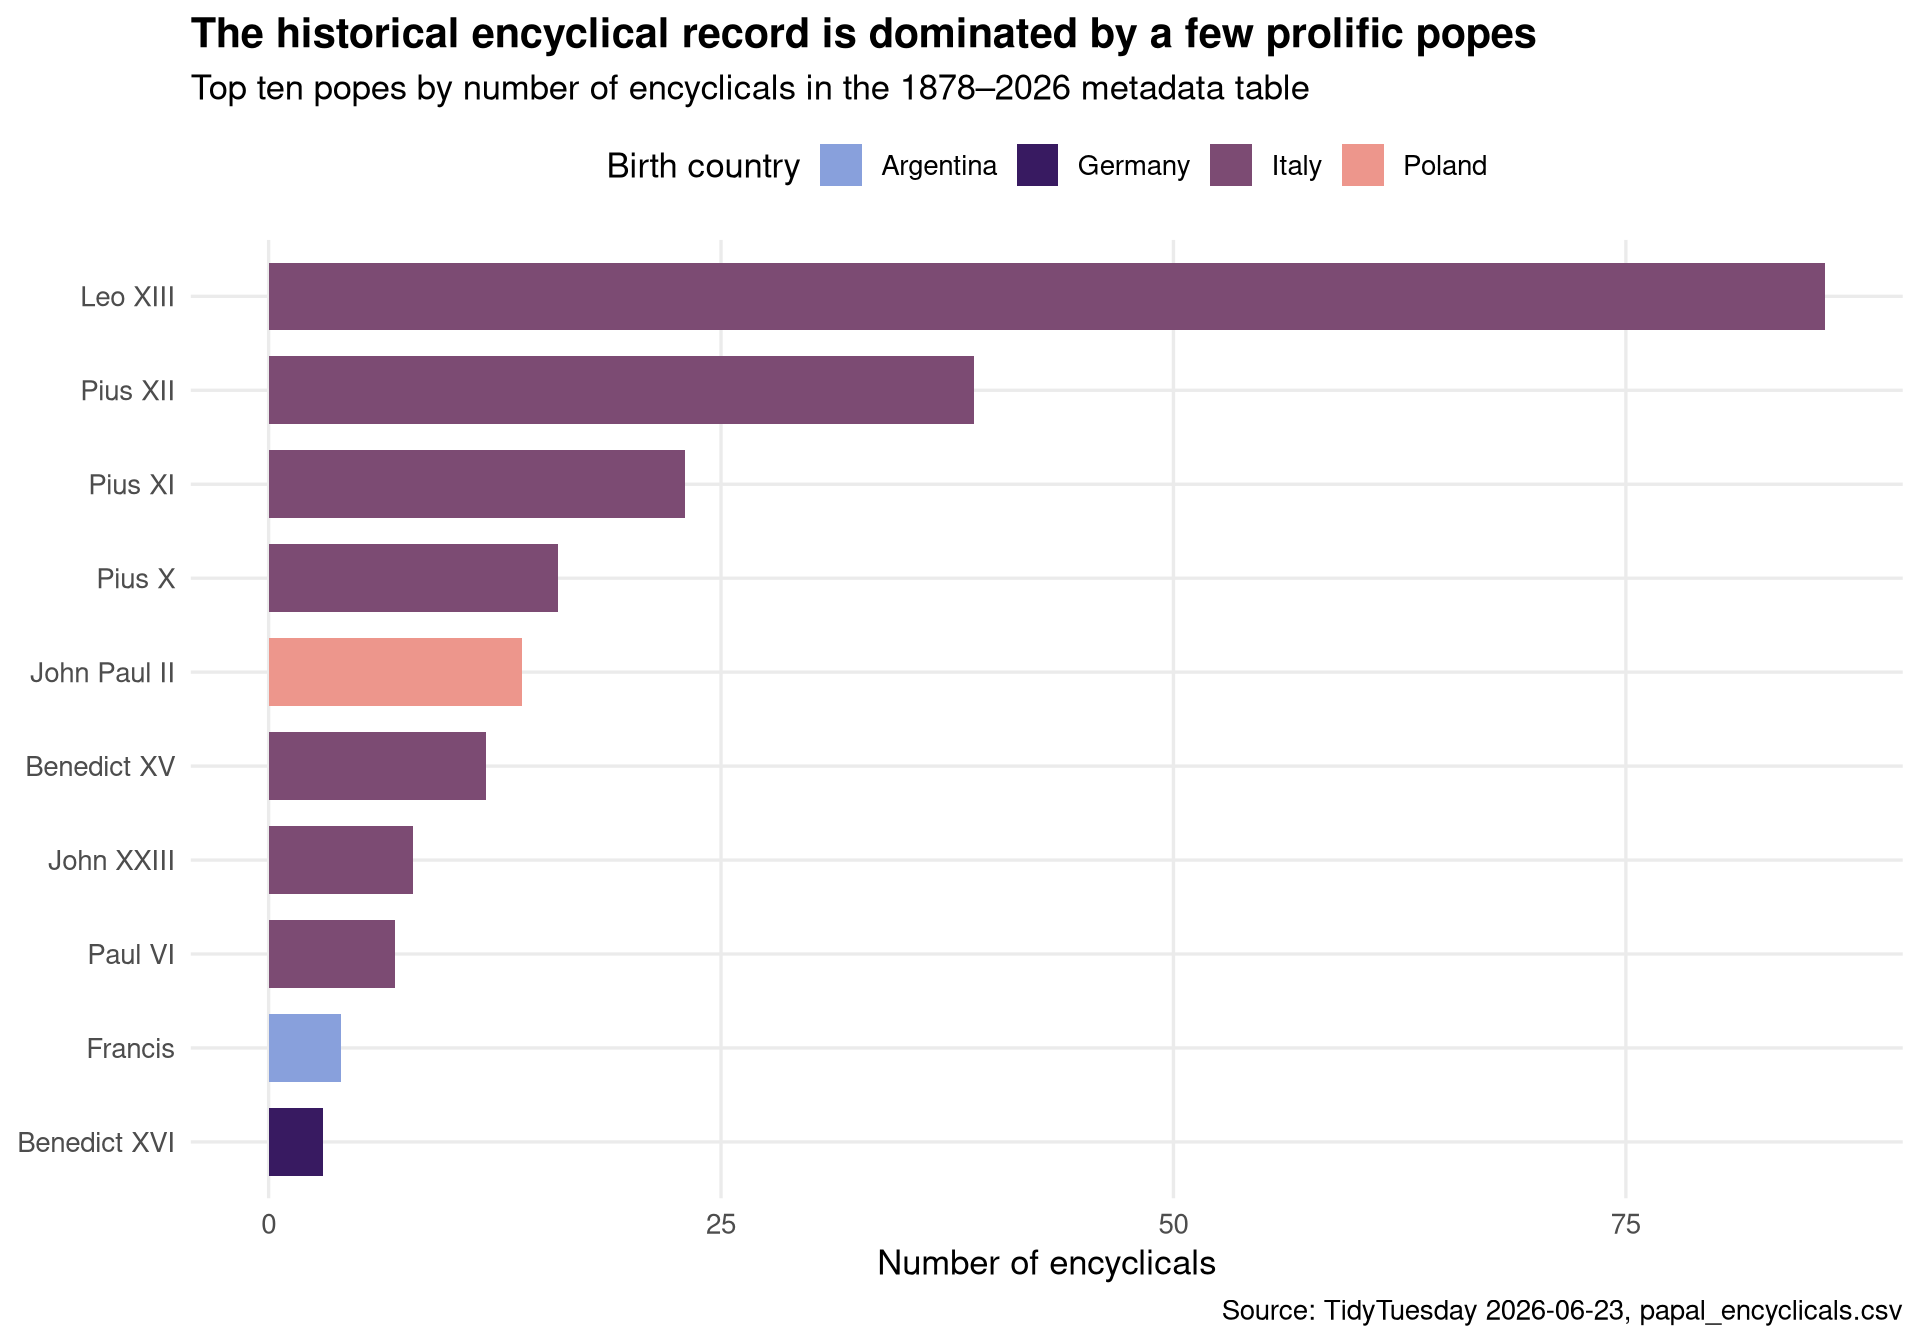
Leo XIII is not just one endpoint of the two-document comparison. He dominates the metadata table, with 86 of the 213 encyclicals. That matters because it keeps the comparison from becoming too symmetric. Rerum Novarum comes from a papacy that used encyclicals frequently. Magnifica Humanitas appears in a communications environment where encyclicals are only one instrument among many.
century_summary <- papal_encyclicals %>%
  mutate(
    century = case_when(
      year < 1901 ~ "19th century",
      year < 2001 ~ "20th century",
      TRUE ~ "21st century"
    ),
    century = factor(century, levels = c("19th century", "20th century", "21st century"))
  ) %>%
  count(century, name = "encyclicals")

century_summary
# A tibble: 3 × 2
century encyclicals
<fct> <int>
1 19th century 76
2 20th century 128
3 21st century 9The metadata table is therefore a reminder about institutional form. The question is not only what each document says about labor or artificial intelligence. It is also what kind of medium the encyclical is at each historical moment: a frequent teaching instrument in the late nineteenth and twentieth centuries, and a rarer intervention in the twenty-first.
Final thoughts and takeaways
The strongest result here is structural, not predictive. Magnifica Humanitas is a larger document, but Rerum Novarum carries longer median paragraphs. Both texts cite scripture, especially the New Testament, but they arrange that shared inheritance differently. And the historical metadata makes Leo XIII unusually prominent: the industrial-era endpoint is not an arbitrary pope in the archive, but the single most prolific encyclical writer in the table.
For a dataset about technological revolutions, that is a useful lesson. The “new” problem does not arrive in a new language. It is pulled through old institutions, old genres, and old citational habits. The machinery changes. The argument has to pass through the chapel door anyway.